Variable Pay Mix and OTE Competitiveness by Sales Role and Market
Quota attainment data shows why OTE figures mislead reps about actual take-home pay.

Sales compensation only works if the ratio between guaranteed pay and at-risk pay matches the reality of what a given role can actually control. That single idea, pay mix as a function of control, explains almost every gap between what a job posting says and what a rep, manager, or VP actually takes home. Quota attainment data backs this up: benchmark data shows account executives hit an average of 42.7% attainment, which means most reps earn far less than the on-target earnings figure listed at the top of their offer letter. On-target earnings, or OTE, is base salary plus variable pay assuming 100% quota attainment. It's a full-performance number, and treating it as a guarantee is where most comp confusion starts.
Averages compound the confusion. CaptivateIQ's 2025 data puts average OTE across all sales roles at $174,000, but the median is $150,000. That gap between mean and median tells you the distribution is skewed by a handful of high-paying senior and enterprise roles pulling the average up, while most individual contributors land closer to the middle. Aggregated numbers like this are directionally useful and structurally misleading at the same time.
No single source settles this cleanly, which is why comp leaders triangulate. RepVue's crowdsourced rep data, another provider's role-specific surveys, Talentfoot's executive-search pools, Pavilion's membership network, and WorldatWork's cross-industry benchmarks all measure slightly different populations with different methodologies. Cross-referencing them produces a defensible range instead of a false-precision point estimate. On their own, none of them can tell you whether your quota multiple is realistic for your sales motion, your pay mix fits how much control a rep actually has over the outcome, or your geography demands a premium you haven't priced in. That takes unpacking role by role, segment by segment, which is what the rest of this piece does.
How pay mix logic works before looking at any role-specific number
Pay mix is the ratio of guaranteed base to variable pay, and it's really a statement about how much income risk a rep is asked to absorb in exchange for uncapped upside. Roles where the person directly controls whether a deal closes justify a heavier variable component, and roles where the outcome depends on team effort, technical support, or the health of an existing account justify a heavier base, even when the numbers get complicated.
Most B2B closing roles cluster around a 50/50 split. Talentfoot's 2026 Sales Compensation Study found roughly half of respondents reporting plans near that even divide, which functions as the gravitational center for account executive comp generally. Individual contributors skewed slightly more variable in that same dataset, while managers and senior leaders both trended toward heavier base, a pattern that tracks with how much direct control each tier actually has over its own numbers.
Company stage moves the needle too. Early-stage companies often run close to 50/50 with equity layered in as a third leg of the stool, betting that upside compensates for lower cash certainty. Mature enterprises lean harder on base, because predictable payroll matters more once a company has thousands of employees and investors watching quarterly guidance.
The base percentage isn't just an incentive lever, it's a floor. A rep on a 70/30 mix still takes home 70% of OTE at zero attainment, so the split functions as much as a guarantee against a bad quarter as it does a motivator for a good one. That reframes what "aggressive" comp design actually means: pushing variable higher isn't free upside, it's transferring risk from the company's income statement onto the rep's paycheck.
That risk transfer appears most visibly in caps versus accelerators. Capped plans protect the comp budget, but they reliably demotivate the reps a company can least afford to lose: the ones blowing past quota. Accelerators, paying 1.5x to 2x the standard commission rate above target according to WorldatWork data, are the preferred mechanism for high-attainment roles precisely because they let top performers keep compounding their earnings instead of hitting a ceiling mid-quarter.
SDR and BDR compensation: the entry tier
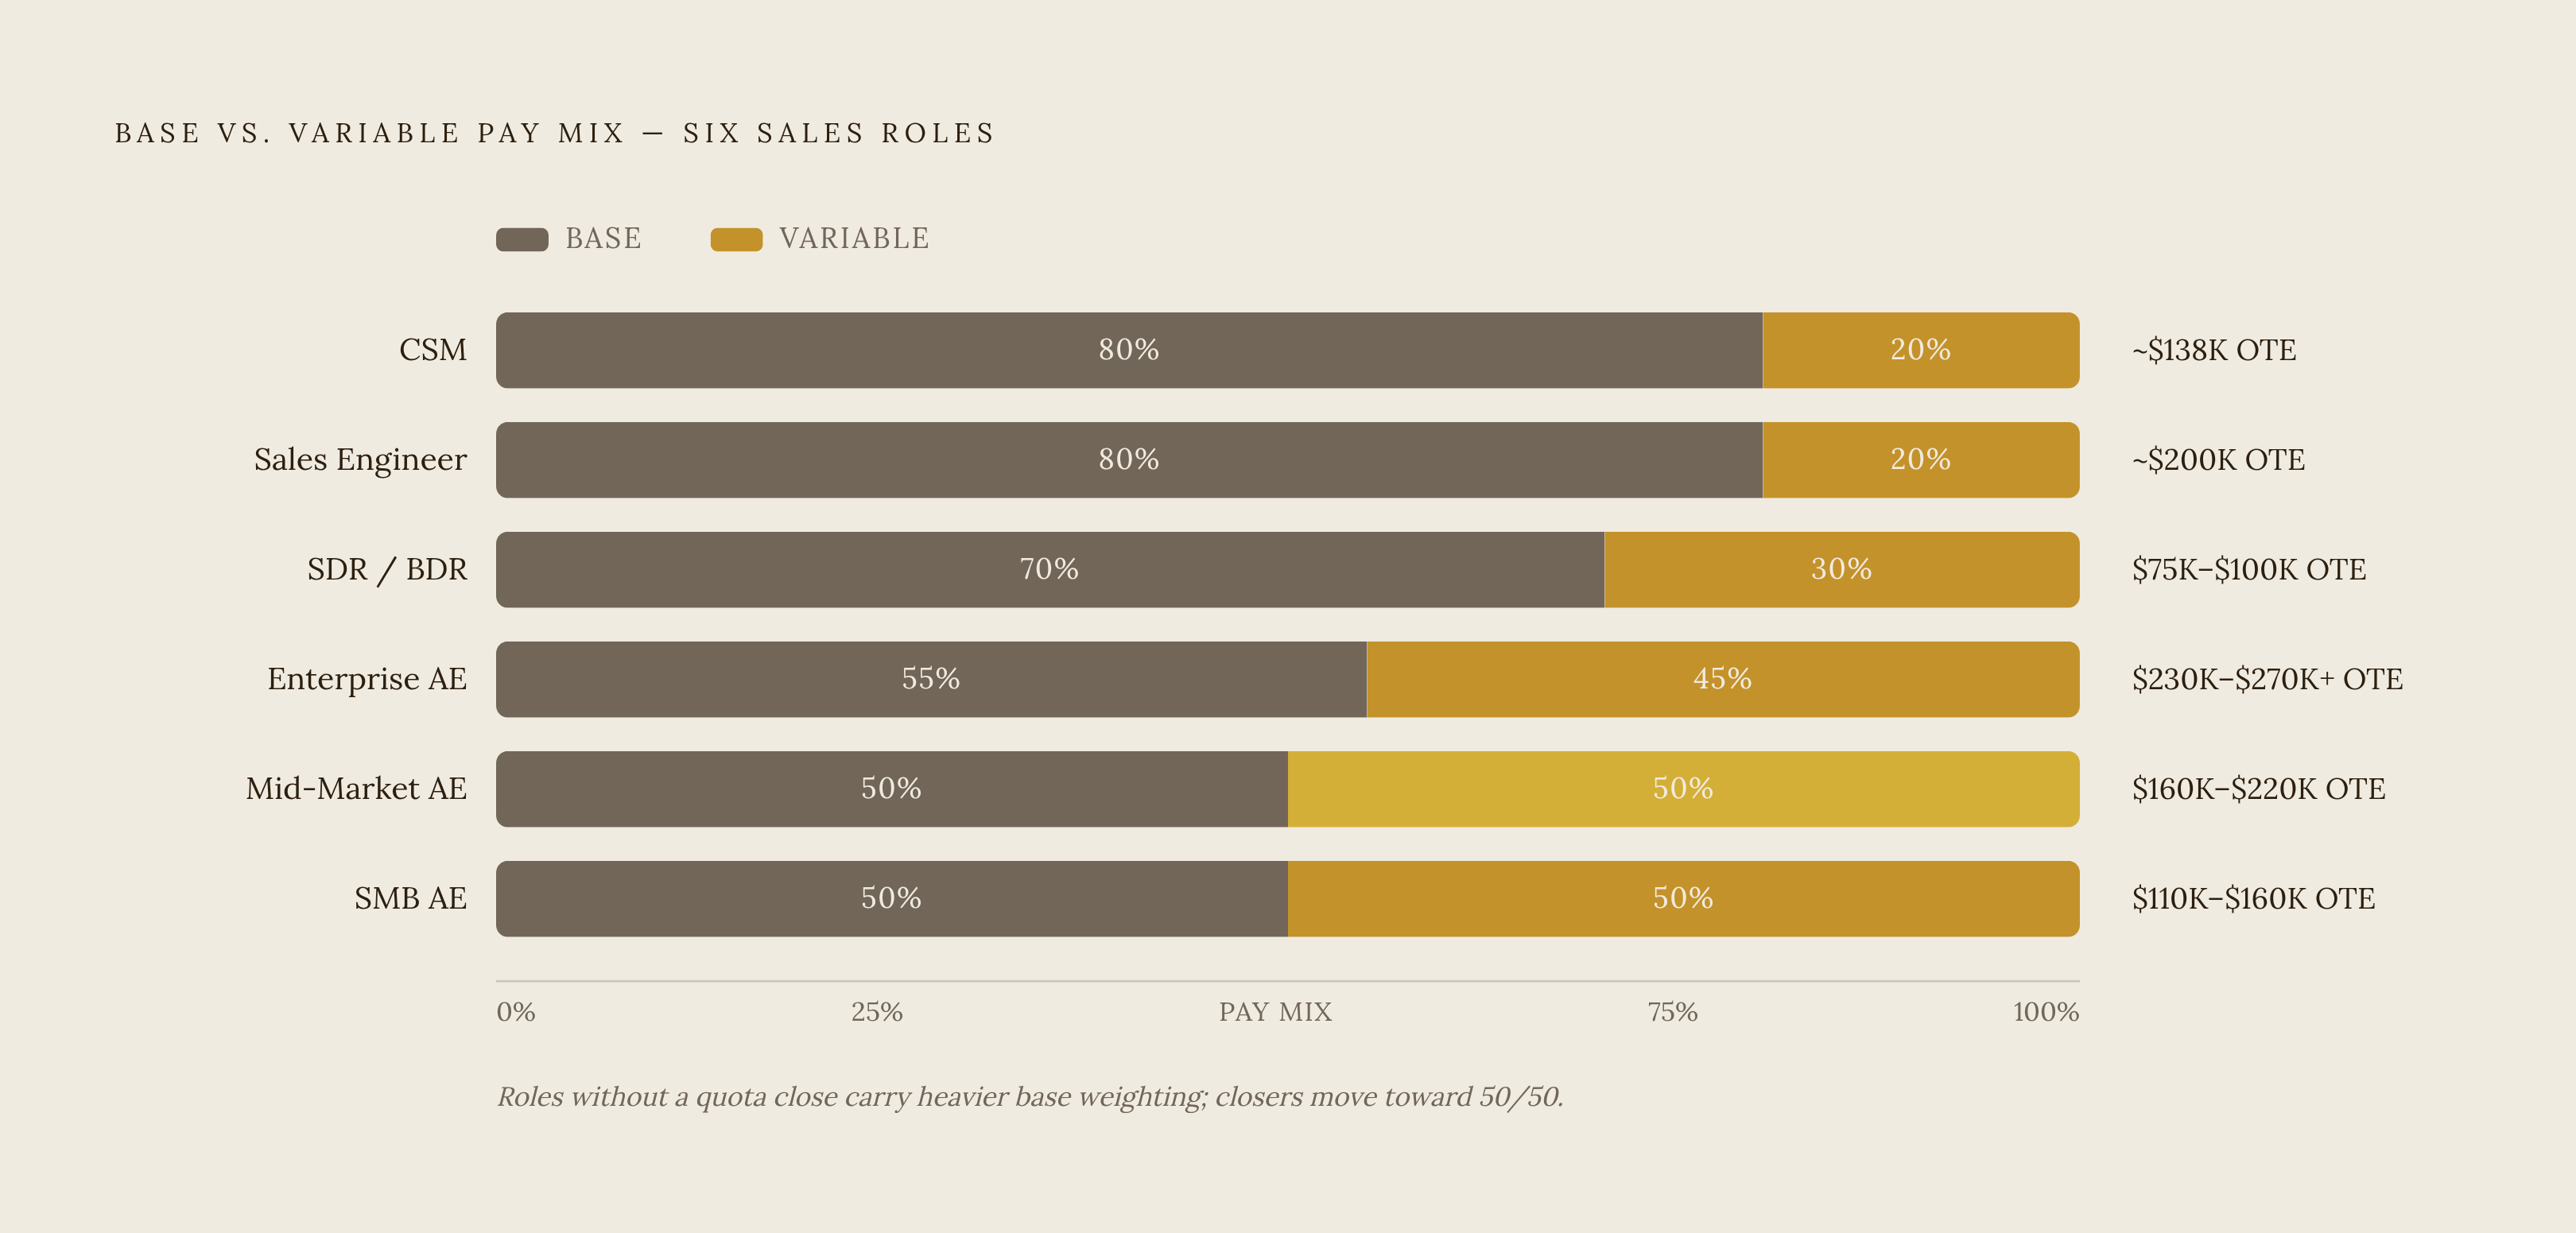
SDR and BDR OTE runs roughly $75,000 to $100,000, with RepVue's 2025 data placing the median SDR OTE at $85,000. The pay mix here is typically 70/30 base-to-variable, the heaviest base weighting of any role in the sales org chart, and for good reason: an SDR doesn't close revenue. They generate pipeline. Their variable comp is tied to activity metrics like meetings booked and qualified opportunities passed, not bookings or revenue, which means the commission-rate mechanics that apply to a closing rep don't translate here at all.
Segment matters even at this level. SDR OTE scales modestly by the segment they support, with SMB-focused SDRs at the lower end of the range and enterprise-focused SDRs at the higher end, reflecting the longer cycles and more complex qualification work that enterprise prospecting demands. Top BDRs can exceed the stated range meaningfully with consistent overperformance, though the ceiling stays intentionally lower than what an AE can reach.
The 70/30 split sends a signal to candidates evaluating the role: this is a stable first professional sales job, not a high-variance bet. Ramp time matters here too. The old six-month ramp norm is compressing toward roughly 4.5 months at most companies, and SDRs feel the squeeze acutely, since building a real pipeline takes a certain amount of calendar time no matter how aggressive the ramp policy on paper says it should be.
Account executive OTE by segment: SMB, mid-market, and enterprise diverge sharply
The AE title covers three genuinely different jobs depending on segment, and the OTE numbers reflect that. SMB AEs run roughly $110,000 to $160,000 in OTE, working shorter cycles at higher volume, typically on a 50/50 mix. Mid-market AEs are between $160,000 and $220,000, typically on a mix near the 50/50 gravitational center, carrying quotas that run to several times their OTE. Mid-market AE comp moved up somewhere between 6% and 9% from 2024 to 2026, faster than general wage inflation, a sign that the segment is getting more competitive for talent, not less.
Enterprise AEs sit well above both, at $230,000 to $270,000-plus. Glassdoor data puts the enterprise AE average at $248,000 OTE, with base pay ranging from $91,000 to $151,000, against quotas that reach several multiples of that figure or more. The pay mix at this level shifts too: enterprise AE comp tends to run 55/45 rather than a clean 50/50, a small but deliberate move toward base that reflects how much longer and less predictable enterprise cycles are compared to SMB or mid-market motions.
Quota multiples tell their own story. The Bridge Group's 2024 SaaS AE data shows a median commission rate of 11.5% of bookings at full attainment, and the median quota-to-OTE ratio for enterprise AEs was 4.5x in 2024, climbing to 4.8x in 2026. Mid-market AEs tend to run at the higher end of the 4x–6x range common for closing AEs in B2B SaaS, while enterprise AEs cluster closer to the lower end. Across the market, that multiple has been climbing: from 4.5x in 2024 to 4.8x in 2026, meaning companies are asking reps to generate more revenue per dollar of OTE than they did two years ago.
Attainment data puts the whole enterprise number in context. With average quota attainment around 74% and 39% of organizations reporting that only 51% to 75% of their sellers reach quota, the enterprise AE with a $248,000 OTE is, in practice, very likely earning meaningfully less than that headline figure. RepVue's median SaaS AE OTE, at roughly $195,000, is a useful single number precisely because it sits between the mid-market and enterprise midpoints rather than at either extreme.
One AE comp structure applied uniformly across SMB and enterprise reps will overpay one group and underpay the other. Segment-specific plans aren't a nice-to-have at mature sales organizations; they're the baseline standard.
Sales engineers and customer success managers: why adjacent roles carry heavier bases
Sales engineers carry a median OTE around $200,000, but the pay mix runs 70/30 or even 80/20 toward base. The logic mirrors the SDR case: an SE supports a deal, they don't own it, and the outcome is a team result rather than something attributable to one person's individual effort. Quota, where it exists at all for this role, is typically pooled or team-based rather than tied to individual bookings.
Customer success managers show median OTE around $138,000, with pay mix skewing 80/20 or heavier toward base, historically the most base-weighted role in the revenue org outside of pure support functions. That's starting to shift. More CSM comp plans now tie variable pay directly to gross revenue retention rather than the softer, judgment-based goals that used to define the role, a change that pushes CSM comp closer to a commission model and adds real complexity to how those plans get administered. ICONIQ Growth data shows over 60% of SaaS companies now list renewals, upsells, and multithreaded account relationships as top compensation drivers, and CSM plan design is visibly catching up to that shift.
Segment spread hits CSM comp hard too, with meaningful OTE variation across SMB and enterprise levels, a wider gap than most comp leaders expect for a role often assumed to be flatter across segments than AE comp is.
Once revenue-retention-linked variable enters a CSM plan, the same operational questions that have always dogged AE commission design, like whether payout triggers on a signed contract, a received payment, or an actual renewal date, and how clawbacks work if a customer churns early, now apply to customer success too. The administrative burden of running these plans is going up right along with the sophistication of the incentive design.
First-line managers and the pay mix shift that comes with people leadership
First-line sales manager OTE runs $200,000 to $280,000, with variable typically tied to team quota rollup and override percentages rather than personal bookings. The pay mix moves toward a heavier base weighting, a meaningful shift from the individual contributor tiers below it, because a manager can shape the environment their reps work in but can't directly close deals on their behalf.
Segment still matters at the manager level. Player-coach roles at SMB companies command lower OTE than their enterprise counterparts, with segment and scope driving a real premium at the top end. The scope and complexity of managing enterprise territories, and the reps who sell into them, commands a real premium.
Pure team-rollup variable creates a structural fairness problem: a manager who inherits a weak or newly-carved territory is disadvantaged relative to a peer who inherits a strong one, through no fault of their own management. Adding a qualitative or judgment-based component to manager variable is the common fix, one that tempers the pure math of team performance with some judgment about what the manager actually controlled.
The Talentfoot 2026 sample is worth a caveat here. 67% of its respondents were leadership-level, and 87% came from companies with 50 or more employees, a skew that helps explain why the survey's overall median OTE of $275,000 lands well above what individual contributors typically earn. Read across the whole dataset, and it looks like sales comp broadly is higher than it is; read at the role level, and the picture gets much more precise.
VP of Sales and CRO compensation: where OTE structure changes and equity dominates
Pavilion's 2025 GTM Compensation Benchmarks, drawn from a sample of 1,200 go-to-market leaders, put VP of Sales OTE at growth-stage companies at $350,000 to $450,000. CRO OTE at the same stage runs $600,000 to $800,000, plus equity. Those numbers sit above the broader executive median: Talentfoot's 2026 sample put the median OTE across its full senior population at roughly $275,000, with 37% reporting OTE above $300,000, a reminder that the Pavilion figures are specifically about growth-stage companies rather than the executive market as a whole.
Pay mix at this level generally tilts toward a heavier base than individual contributors carry, with variable tied to total organizational quota attainment or ARR targets rather than any individual close. Equity is the real variable to watch here, because it often dominates total compensation at the senior-leader level in ways that a bare OTE comparison completely misses. Two offers with identical headline OTE numbers can represent wildly different total value once the equity grant, vesting schedule, and company stage get factored in.
Budget allocation reflects how much weight organizations put on getting this right: companies typically target more than 30% of compensation as variable pay for executives, compared to just 6% to 7% of payroll budgeted for broad-based variable pay across the rest of the org. That gap is a signal in itself about where companies believe leverage actually lives.
Accelerator design matters more at this tier than anywhere else in the comp stack. Uncapped commission structures with accelerators, paying something like 1.25x at 125% attainment, are the standard for top-performing senior leaders, and capped plans at this level create strong incentives for top performers to look elsewhere. A VP or CRO who's blowing past target and hits a ceiling has every reason to look elsewhere, and they usually do.
Attainment at the leadership tier looks different from the individual-contributor numbers cited earlier. Talentfoot's 2026 data shows roughly 71% of respondents hit or exceeded quota in the prior year, well above the roughly 42.7% attainment rate benchmarked for account executives. That gap reflects a structural reality: leadership quotas tend to get set with more organizational visibility and control than individual rep quotas do, which makes them more achievable by design.
How geography and company stage adjust every number in the table
Geography still splits the market. Roughly 40% of B2B SaaS employers use a single national OTE figure regardless of where an employee lives, while the remaining 60% use somewhere between two and four geographic zones. That's not a stable number over time, either. The geographic pay differential narrowed between 2020 and 2023, as remote-first hiring pushed many companies toward flatter, nationally leveled pay, then partially widened again in 2024 and 2025 as some employers reverted to anchored, zone-based pay. Anyone benchmarking against 2022 geographic data is almost certainly working from an outdated differential.
Within any given role-and-segment benchmark, city, company stage, and role scope all add variance on top of what geography alone explains. The same mid-market AE title can carry a 30% to 40% swing in OTE depending on sector and local market conditions, which is a wide enough range that a single number in a benchmark table should be treated as a starting point, not a target to hit exactly.
Company stage reshapes pay mix on its own axis. Early-stage companies, Seed through Series A, commonly run 50/50 with significant equity attached. Growth-stage companies, Series B and C, shift toward 60/40 or 70/30 base-heavy structures as predictable cash comp becomes more valuable to both the company and the rep. Mature enterprises lean further toward base still, prioritizing stability over the equity-driven upside that defines earlier-stage comp.
Sales comp as a percentage of revenue is a structural check worth applying here. Early-stage companies often see sales comp consume 25% to 40% of revenue, which sounds alarming until you remember the revenue base is still small. At scale, once a company reaches a much larger ARR range, that ratio drops to roughly 12% to 18%. Mature public companies run 8% to 12%. That ratio is a useful sanity check on whether a given OTE level is actually sustainable at a company's current revenue, independent of whether it looks competitive on a benchmark chart.
Industry adds yet another layer of variance: the same job title can carry a 30% to 40% OTE swing depending on sector, which means SaaS and B2B technology benchmarks shouldn't get imported wholesale into financial services, healthcare, or industrial sales comp design without real adjustment. And a newer factor is starting to show up in the data: RevOps and Sales Ops talent with genuine AI fluency commands a 5% to 12% premium over standard benchmarks heading into 2026, an adjustment that most published role tables haven't caught up to yet.
Quota multiples and attainment distributions as measures of plan health
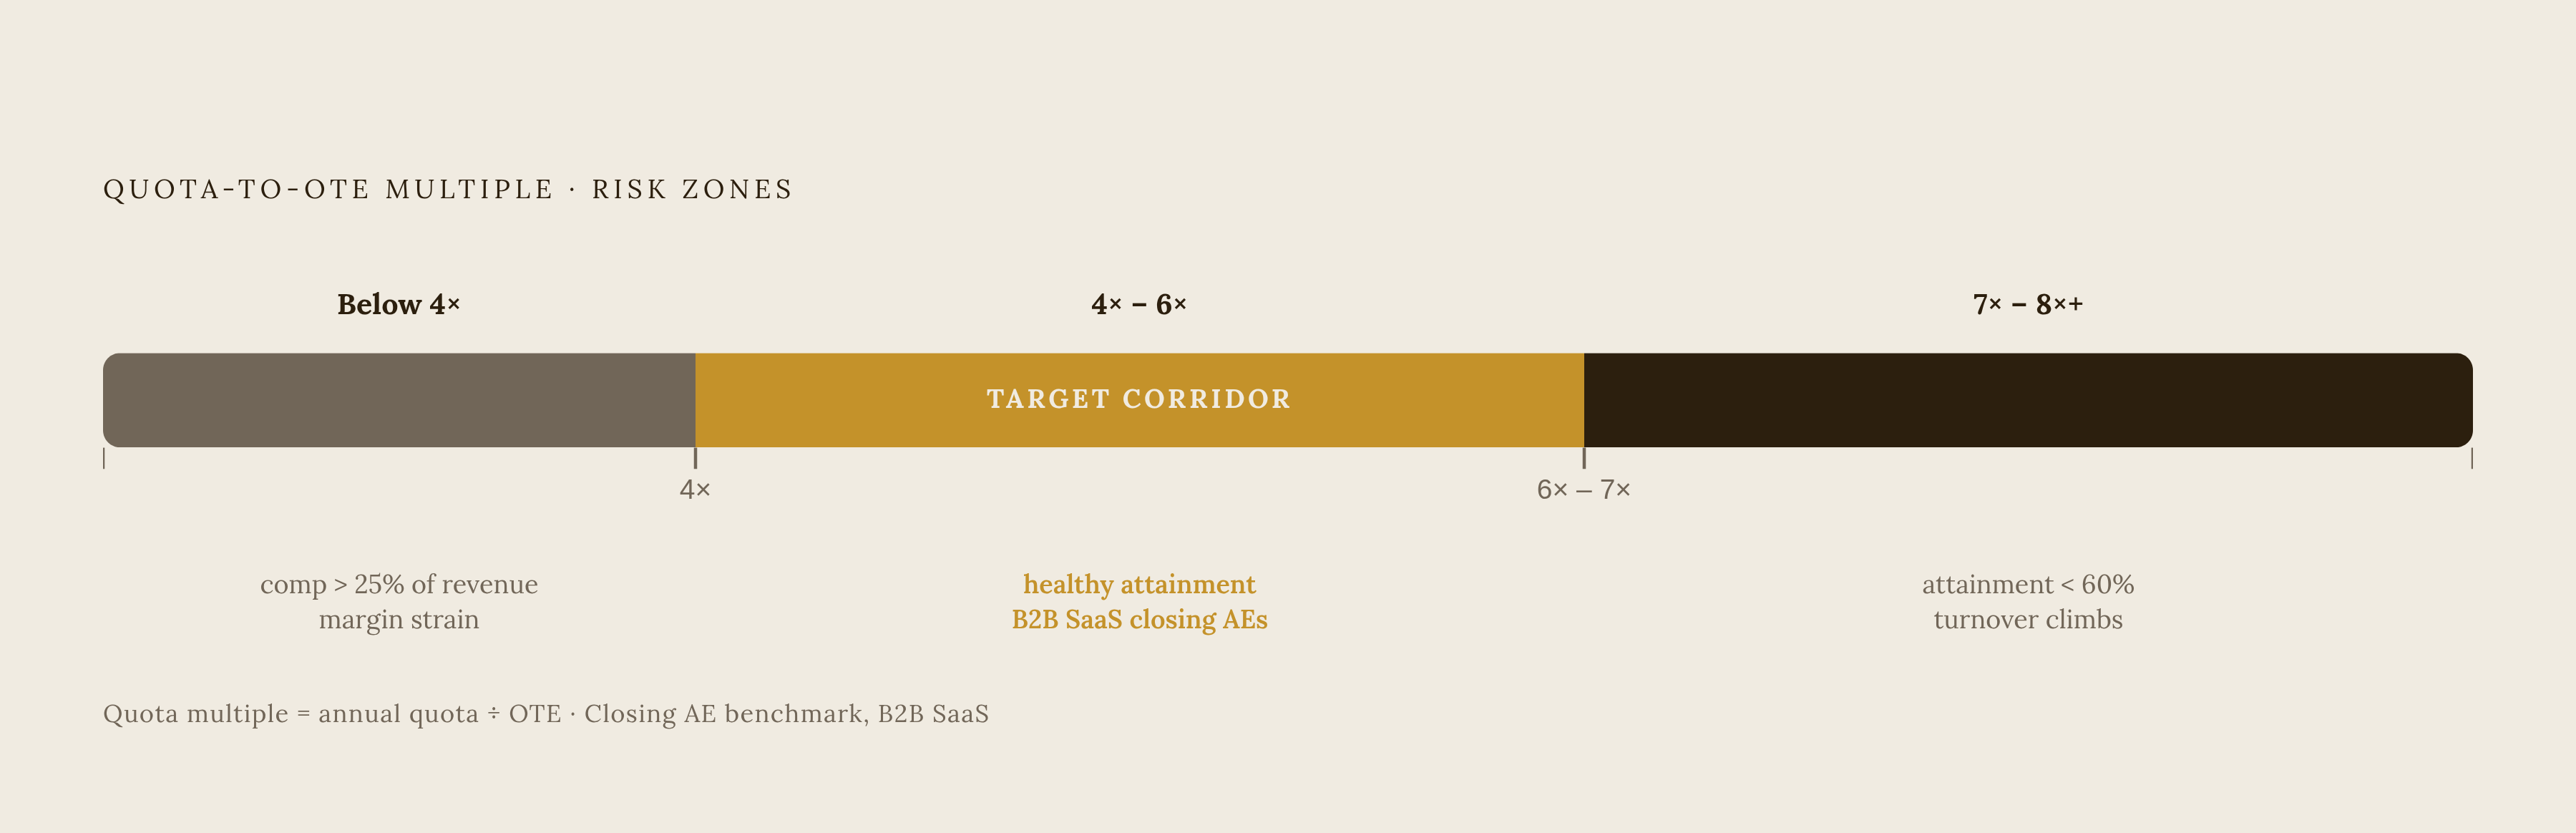
The quota-to-OTE multiple is one of the cleanest diagnostic tools available for checking whether a comp plan is actually healthy, and the range for closing AEs in B2B SaaS runs 4x to 6x. Push the multiple to 7x or 8x, demanding a rep generate seven or eight dollars of quota for every dollar of OTE, and attainment reliably drops below 60%, with turnover climbing right alongside it. Reps recognize an unreachable number quickly, and they don't stick around to underperform against it indefinitely.
Drop the multiple below 4x, on the other hand, and the math runs the other direction: comp expense as a share of revenue climbs past 25%, a level that starts to strain margins regardless of how motivated it makes the sales floor. The multiple, in other words, functions as a direct expression of how a company balances rep motivation against the cost of running the sales org. It's a direct expression of how a company is balancing rep earning potential against the cost of running the sales org at all, and it appears in attainment distributions before it raises concerns on an income statement.