Benchmarking Quota Attainment Distributions to Diagnose Commission Overspend
Align commission spending to rep performance by mapping where your payouts actually concentrate.

Commission overspend is rarely explained by rates alone. Benchmarking quota attainment distributions shows Finance and RevOps whether excess payouts come from quota design, accelerator mechanics, or a small group of outsized earners. The right fix depends on the shape of attainment across reps, and structured commission data makes that shape visible and actionable.
Why commission overspend is usually a distribution problem, not a rate problem
A commission budget overrun often prompts a rate cut or a tighter accelerator threshold. Both responses change what the plan pays before anyone has checked why it went over budget. When a small cohort blows past quota while most reps finish well below it, the spending problem lies in how the plan rewards that split. The base rate alone does not explain the concentration of liability.
A bimodal distribution makes this distinction clear. It contains a large low-attainment group and a concentrated top tier far above quota, with little between them. A plan modeled around average attainment can miss the cost of that upper tier because the average conceals the split. The resulting overrun reflects a mismatch between the population the model assumed and the population the plan actually pays.
That mismatch calls for a different response from a genuinely excessive rate. Cutting rates reduces earnings for average performers without correcting the conditions that concentrate accelerator spend at the top. Quota recalibration or changes to accelerator mechanics address those conditions more directly. Finance needs to see the shape of attainment to choose the right lever.
What attainment distributions actually look like across B2B sales organizations in 2026
Bridge Group's 2026 AE research places the share of reps achieving annual quota at roughly half, down from prior years. That finding challenges the assumption that most reps cluster near their targets. For commission planning, quota achievement is not a dependable description of the typical rep's outcome. A model built around that assumption can misrepresent both the underperforming base and the overperforming tail.
Bridge Group's 2026 AE research also found fewer companies in the healthy mid-range attainment band and more in the danger zone of very low attainment. This company-level benchmark gives an organization a way to put its own rep-level results in context. This company-level benchmark shows why Finance needs to examine the spread to assess how broadly healthy performance is, while leaving the shape of any individual sales team's distribution undetermined.
If the average looks strong while most reps are below quota, a smaller group of high performers is pulling it up. Those performers are also where accelerator spending concentrates. The mean shows how attainment balances out across all reps, while the distribution shows how much each group adds to that balance. That distinction lets Finance move from recognizing a budget variance to locating the reps and plan mechanics responsible for it.
How over-assigned quotas create the skewed distribution that drives accelerator overspend
Intentional quota inflation can create the split that an average hides. The cost-control logic is that a harder target makes accelerated earnings harder to reach. At the organizational level, however, assigning an inflated number to every rep places much of the team in the low-attainment zone before the quarter starts. The plan then applies decelerators to most reps, whose targets were a poor match for how much they could sell. Lower payouts across that group come with weaker motivation and leave the underlying quota design unchanged.
Reps with the best territories, strongest pipelines, or longest tenure may still exceed the same inflated target. They cross accelerator thresholds that were priced on the assumption that quota would be difficult to reach. Quota inflation has changed the challenge for the population without removing the advantages that sustain the high-attainment tail.
This is the spending paradox. Finance raises quotas to control costs, yet creates the conditions for concentrated accelerator payouts while failing to motivate the majority. The quota-setting method can deepen that split when it starts with a board growth number and divides it across the team. That top-down approach leaves out ramp curves, territory quality, and pipeline supply. A bottoms-up, CRM-anchored approach takes those inputs into account before targets are locked, so quota design reflects how much reps can sell and what that will mean for commission liability.
How accelerator mechanics translate a skewed distribution into actual overspend
Accelerators turn the attainment split into a spending variance because the payout rate changes once a rep crosses a threshold. Above quota, each additional point of attainment can carry materially more commission liability than a point earned at the base rate. Higher accelerator tiers increase that difference further. As a result, low attainment at one end of the distribution does not simply cancel high attainment at the other. The commission cost depends on where performance falls relative to the plan's thresholds.
A model built around the median rep misses this effect when reps in the upper percentiles are well into accelerator territory. The median describes the middle of the population. An average-based model has a related weakness because it spreads performance that is actually concentrated. If a meaningful cohort reaches accelerated tiers, applying middling attainment across the board leaves that cohort's liability unbudgeted.
Decelerators cut rates below a threshold, but the lower payouts to reps in the lower percentiles may not cover the accelerated earnings of those in the upper percentiles. When most reps already occupy the low-attainment zone, the motivational cost also falls heavily on that group. An aggregate commission line can hide both effects and leave Finance attributing the variance to a strong performance quarter.
The appropriate test is scenario modeling against the actual spread of attainment before a plan launches. Finance should model commission liability at the 10th, 25th, 75th, and 90th percentile. These points expose how the plan behaves below, around, and above the center of the distribution. Accelerator thresholds and multipliers can then be priced against the range of outcomes the population actually produces.
Reading the distribution as a diagnostic: which shape points to which root cause
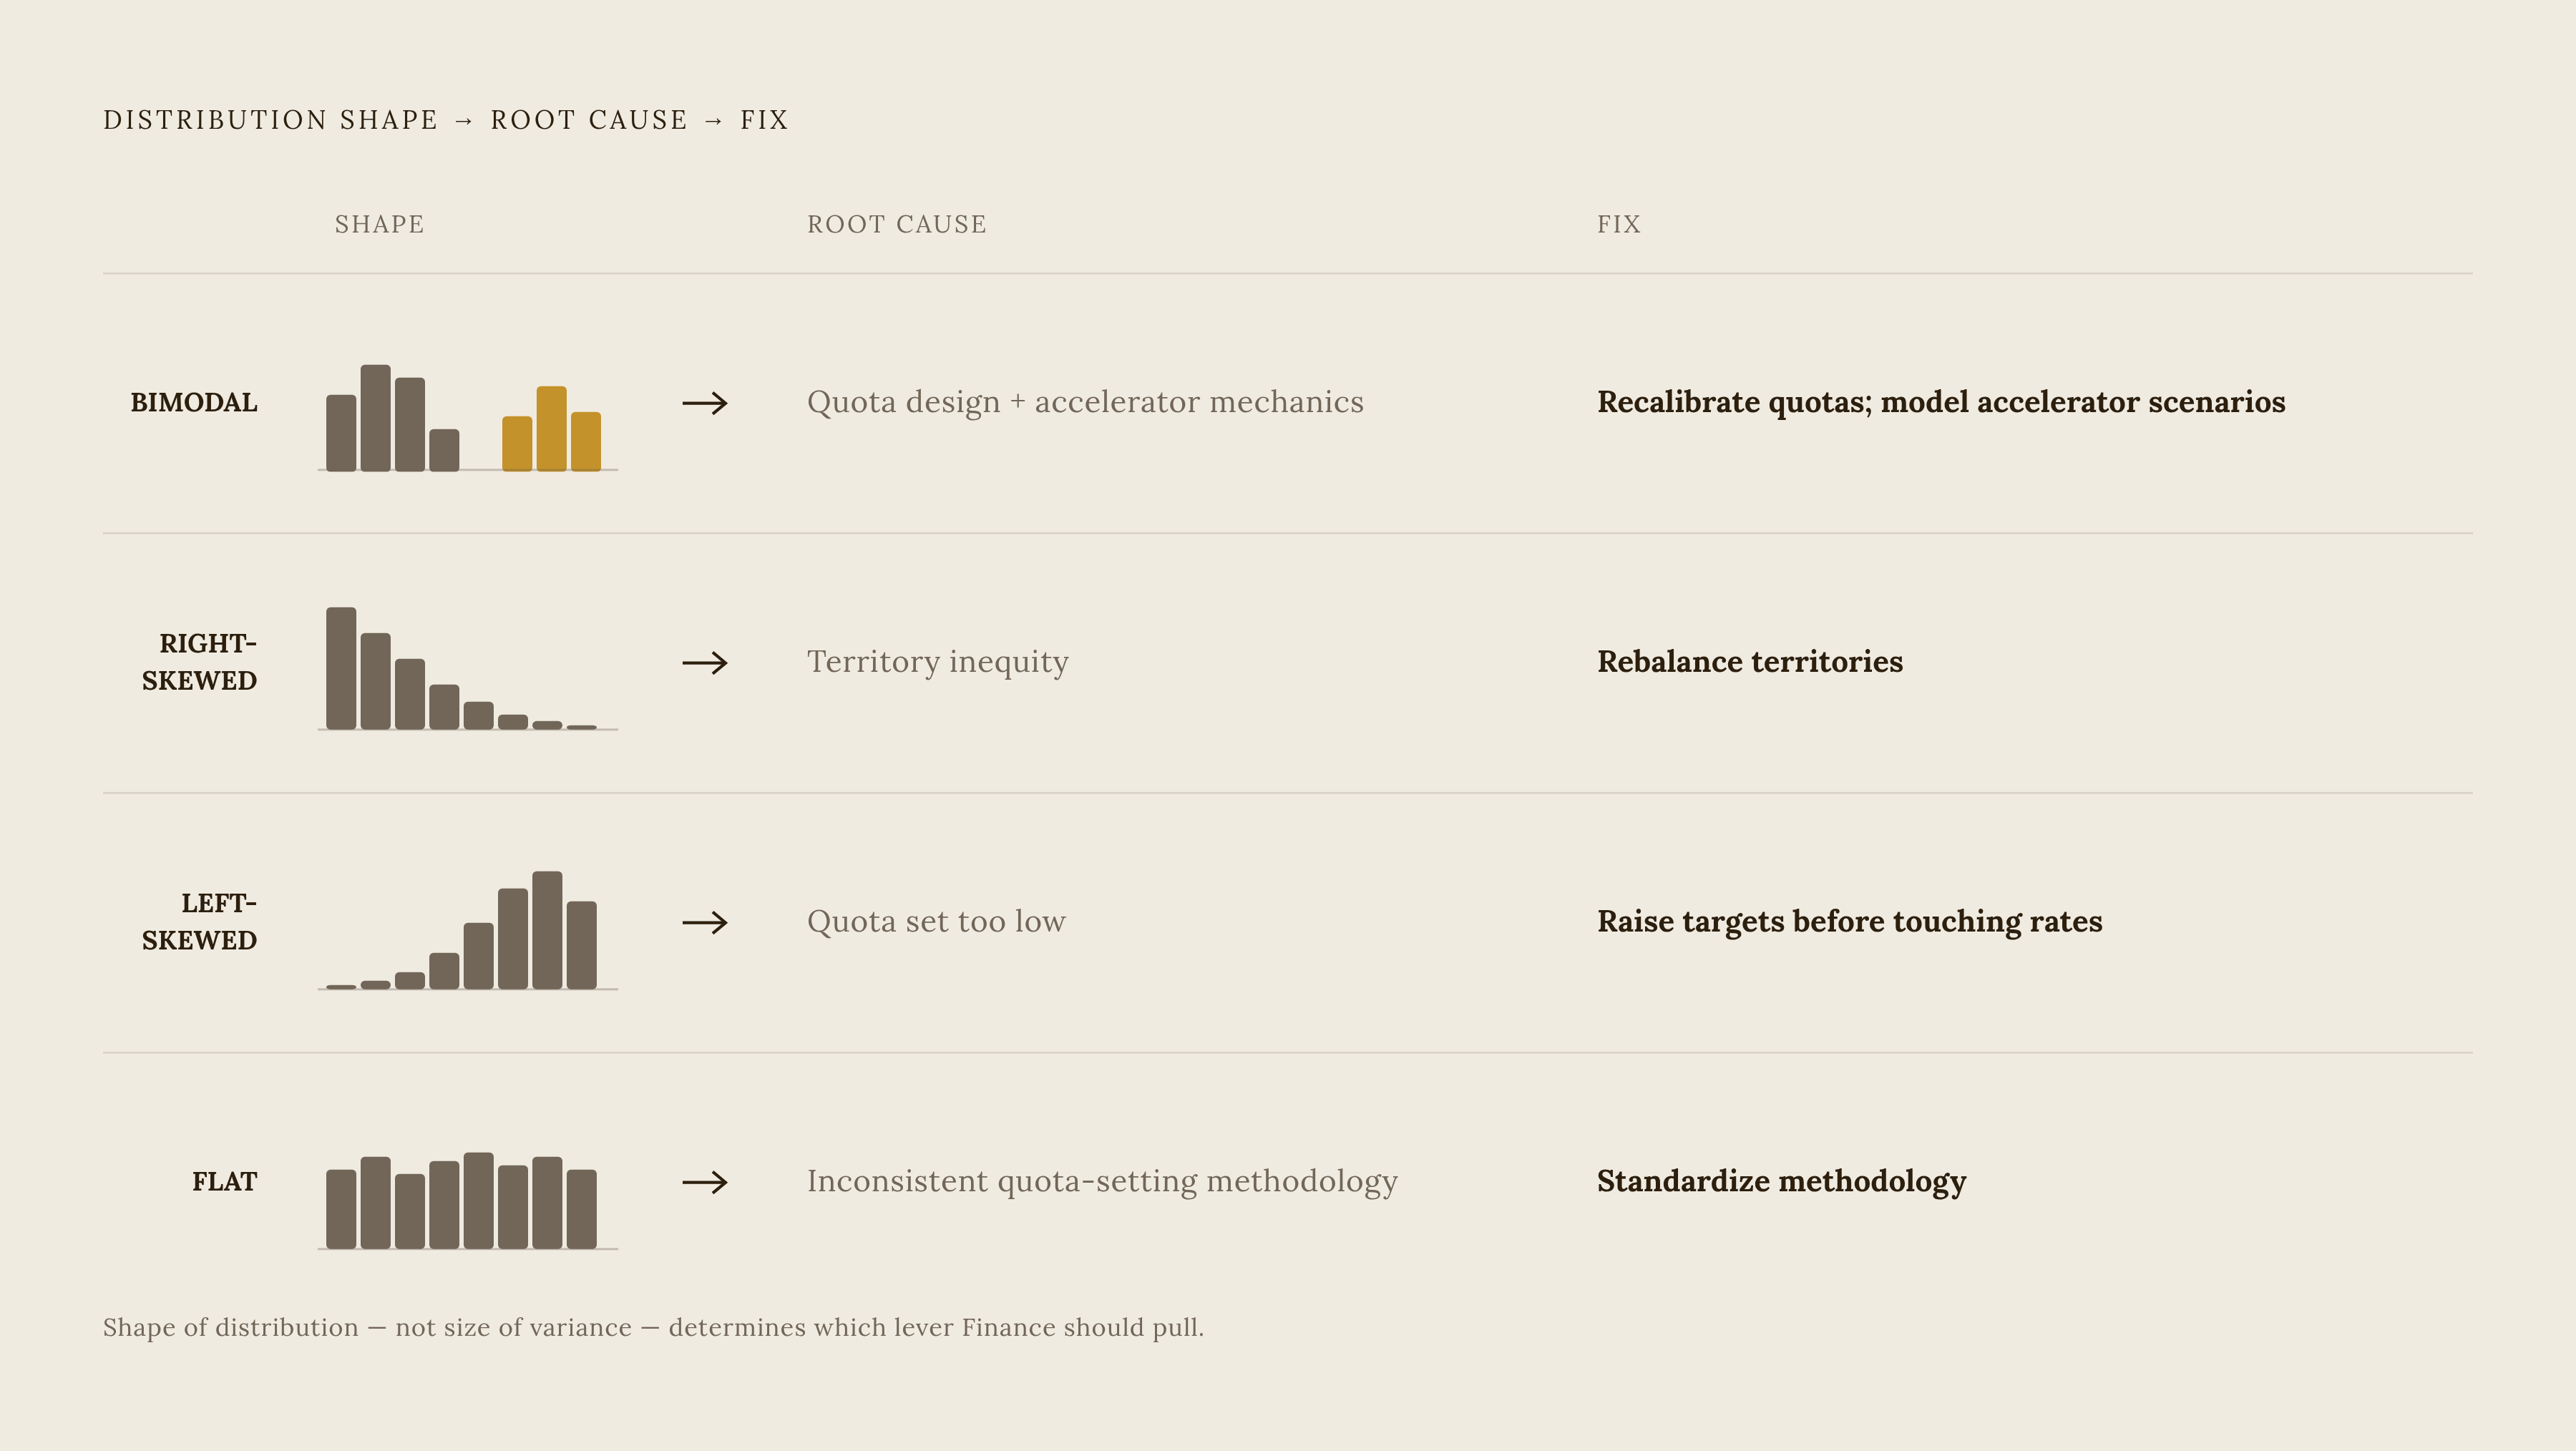
A distribution becomes useful when its shape points to a specific operational cause. Finance and RevOps are not simply looking for an unusual histogram. They are looking for the relationship between where reps finish and where the plan spends. Different shapes suggest different failures, so a single response to every budget overrun is unlikely to address the cause.
A bimodal shape points first to quota design combined with concentrated accelerator spending. The visible pattern is a large cluster well below quota, a small group far above it, and little in between. That gap suggests the target is not providing a calibrated challenge across the population. Finance can tentatively conclude that broad rate cuts would treat both groups alike even though their results are very different. The targeted response is quota recalibration and accelerator scenario modeling.
A right-skewed shape points more directly to possible territory inequity. Most reps sit below quota, while a long tail of over-attainers stretches upward without a clear break that would make it a second cluster. Those over-attainers may hold accounts with the highest close probability while the rest of the team works structurally inferior books. Finance needs to test whether access to opportunity explains the tail. If it does, territory rebalancing addresses the imbalance more directly than plan redesign.
A left-skewed shape changes the conclusion because most reps are at or above quota. There is reason to question rates when a large majority keeps earning accelerated payouts and the excess comes from more than a small group. Even then, the first issue is whether quota was set too low. The first change should be to raise the target before touching rates. This distinguishes a broadly easy quota from a plan that is expensive only for an advantaged minority.
A flat shape points to differences in how quotas are set. Attainment is spread evenly across a wide range, without a clear concentration around a common level of challenge. Some targets may have been set from territory data while others came from a growth percentage. The appropriate fix is methodology standardization.
Why spreadsheet-based commission processes cannot produce this diagnostic
These distinctions require consistent rep-level attainment and payout records across periods. A histogram from one commission file cannot show whether the shape changed after a quota adjustment or whether different plan rules explain the movement. Formula drift, manual overrides, and file versioning mean last quarter's figures may not be directly comparable with this quarter's. The structure of the record obstructs this diagnostic.
Silent calculation errors make that obstacle more serious. A formula cell can be overwritten, or an error in a nested conditional can miscalculate payouts across an entire column of reps. The error may go unnoticed until a rep disputes a statement, sometimes pay periods later. If those errors are in the payout record, analysis may read a pattern in faulty calculations as a compensation problem.
Opaque outputs also encourage reps to maintain their own commission tracking. This shadow accounting creates parallel records and disputes that consume time otherwise available for structural analysis. Manual corrections then make the period-to-period record harder to interpret. The process keeps Finance occupied with reconciling individual statements rather than explaining the population.
The fundamental limitation is that a spreadsheet snapshot is not a dependable system of record. The diagnostic requires answers about how attainment shifted after a quota change, which plan version applied to a period, and who approved the payout. Disconnected commission files do not reliably preserve those relationships. Without them, a distribution can describe a moment but cannot support a trustworthy explanation of why spending changed.
What structured commission data makes possible: from distribution visibility to targeted fixes
Structured commission software linked directly to CRM deal data keeps a consistent record of rep-level attainment from one period to the next. Finance can see the distribution in that same record without having to rebuild the rep population from uploaded files. This continuity connects the shape of attainment to the plan rules that produced the payouts. It makes benchmarking an ongoing diagnostic.
Locked pay periods and logged approvals show which data was approved for payment. When a bimodal pattern appears, the audit trail gives Finance a basis for distinguishing actual attainment from a data problem. Rep-level visibility into earnings, quota progress, and statement detail also reduces the need for shadow accounting. Fewer disputes and fewer manual adjustments after close make the record cleaner.
With that foundation, scenario modeling can apply plan rules to the full rep population. The percentile tests described earlier now feed into a calculation for the whole distribution, with no need to run them as separate spreadsheet scenarios. Finance can see how a proposed quota recalibration or a change to an accelerator threshold would change liability for the same group of reps. RevOps can use that analysis to assess the targeted response, including territory rebalancing where the distribution points to unequal opportunity.
The workflow follows a clear sequence. Finance pulls the distribution from structured payout data, identifies its shape, and uses that shape to diagnose the likely root cause. The targeted change is then modeled before it goes live.
As the team grows and its distribution widens, pricing by compensation plan avoids making the cost of structured commission data rise directly with headcount. It removes an incentive to remain in spreadsheets when distribution analysis is becoming more valuable. Diagnose where commission liability concentrates, then change the lever that creates it.