Commission Cost Impact of Sales Team Expansion and Hiring Ramp
Ramp draws, plan gaps, and turnover compound commission costs that standard hiring models miss.

Sales team expansion creates both a larger payroll and a commission cost curve. Ramp draws, gaps in plan design, and turnover each add to what the business owes in ways a headcount forecast can miss. RevOps and Finance need to model all three together to produce an expansion budget that reflects what hiring will actually cost.
Why standard hiring models undercount commission cost
A standard hiring model counts salary, benefits, and recruiting fees, then assumes commission will vary with what reps sell once they are productive. That assumption fails as soon as a new hire receives a draw. Commission liability begins on day one of ramp, before a single deal closes, rather than at the point when revenue starts to justify the hire.
The error goes beyond the first payment because commission cost changes as hires move through ramp, work under the plan, and sometimes leave. Ramp draw exposure, plan-design gaps, and compounding turnover are distinct phases, but their costs connect. Missing any one leaves Finance with an incomplete expansion forecast. The modeling failure in each phase is preventable once it is visible.
What the ramp period actually costs in commission dollars
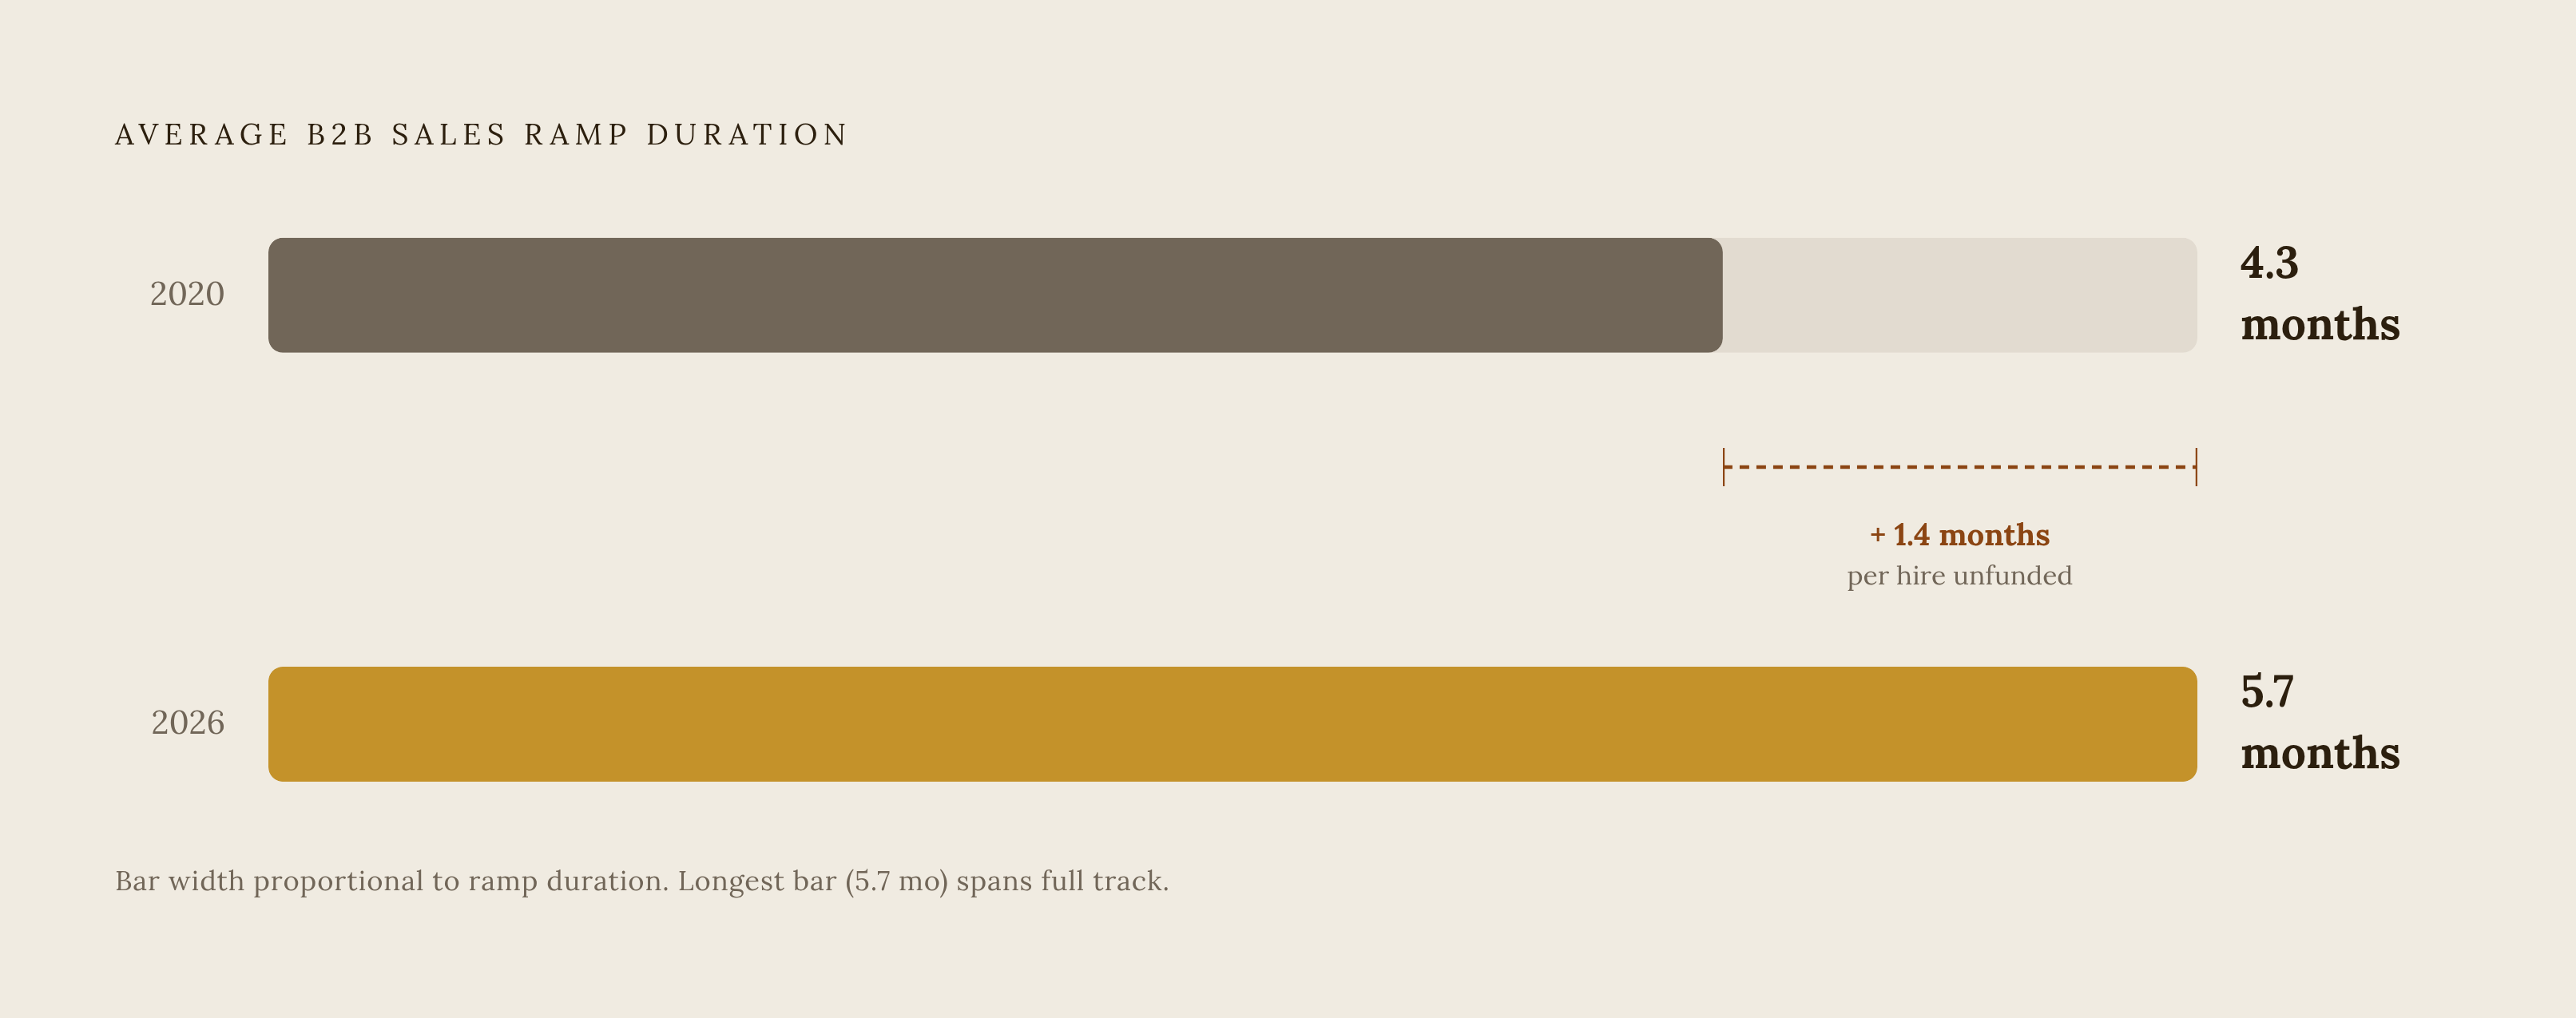
A ramp draw pays against quota attainment that has not yet occurred. It is typically recoverable if the rep underperforms, although non-recoverable draws are also used during early ramp. Finance needs to determine how much draw exposure accumulates before the rep reaches full productivity. The 2026 benchmarks place average B2B sales ramp at 5.7 months, up from 4.3 months in 2020. Every added month extends the window that Finance must fund.
The calculation to start with is monthly base-equivalent draw × ramp months × (1 − average productivity rate during ramp) = unproductive payroll per hire. The draw establishes the monthly amount, ramp duration establishes the payment window, and the productivity adjustment identifies the portion unsupported by productive selling. Using the calculation for each hire puts a dollar amount on the ramp assumption. Applying it to the hiring schedule then shows how much exposure overlaps. A cohort creates concurrent draws as reps start before others become productive.
That distinction matters even for SDRs, whose ramp is shorter at approximately three months. Larger hiring cohorts can offset the shorter duration and build aggregate exposure quickly. Prorated quotas provide the standard control by setting lower attainment expectations at the start and increasing them toward full quota. The 2026 commission benchmarks describe full quota by month three to four for SDRs and month four to six for AEs, depending on role. Finance needs that schedule documented and locked before the rep starts, or the draw liability remains indeterminate until the pay period closes.
Recoverability does not eliminate the need to budget the draw. Recoverable draws are rarely collected in practice when an underperforming rep exits with an outstanding balance. Clawback enforcement also brings legal and reputational friction. The model therefore needs a realistic collection assumption rather than treating contractual recovery as cash that will necessarily return.
How plan design gaps widen as headcount grows
Once hires become productive, the business shifts from paying for ramp to paying for attainment under the plan. A structure that worked at five reps can produce unbudgeted payouts at fifteen without having been wrong for the original team. Its quota-to-OTE ratio, accelerator triggers, and cap decisions may simply never have been tested against a larger attainment distribution. Expansion exposes those assumptions to more reps reaching different payout levels at once. Finance must therefore model the distribution as well as what a representative rep would earn.
Accelerators are particularly sensitive to this change. When they activate at full quota and apply to all revenue above that threshold, payouts can rise sharply if a cohort reaches quota in the same quarter. Correctly prorated ramp schedules and a strong product cycle can align to produce that result as new hires reach full productivity. A forecast based on median attainment will miss the upper-tail cost. The design control is to cap extreme payout multipliers and test accelerator expense across assumed attainment distributions.
That control is different from capping total commission. A commission cap protects the payout budget but can drive top performers to leave, turning an avoided overrun into a replacement cost. Finance needs both sides of that trade-off in the model. An uncapped plan can cost more in an upside quarter, while a cap that top performers will not accept can add to turnover costs.
Team quota construction creates another gap when the board target substitutes for the sum of ramp-adjusted individual quotas. Reps receive commission on individual attainment regardless of whether the team reaches the aggregate board number, so the difference can leave payouts unbudgeted. Role mix further changes the calculation because AEs, AMs, and CSMs have materially different rate structures and pay mixes. Treating them as interchangeable headcount conflates costs that respond differently to attainment. Adding roles therefore calls for modeling the plan for each role as well as a stress test for the larger team.
How turnover transforms a one-time hiring cost into a recurring one
Plan design failures can also send the model back to the beginning. Compensation below market, quota set at an unrealistic multiple of OTE, and a plan too complex to explain are causes of early departure rooted in compensation design. When a rep leaves, the business pays to recruit and train a replacement and bears the cost of lost productivity. The new hire then goes through another ramp period with another draw.
Opacity can trigger the same loop even when the underlying payout terms are sound. Reps who cannot see their commission calculation in real time build their own tracking. When that shadow accounting diverges from the official payout, a dispute can become a separation event.
Sales turnover is structurally higher than cross-industry norms, so replacement hiring cannot sit only in a downside scenario. Finance needs to apply an annual turnover assumption to the team size it forecasts. As headcount grows, that assumption produces more replacement cycles even if the rate itself does not change. Under-designed plans can accelerate the cycle by creating additional departures.
Building a commission cost model that covers all three phases
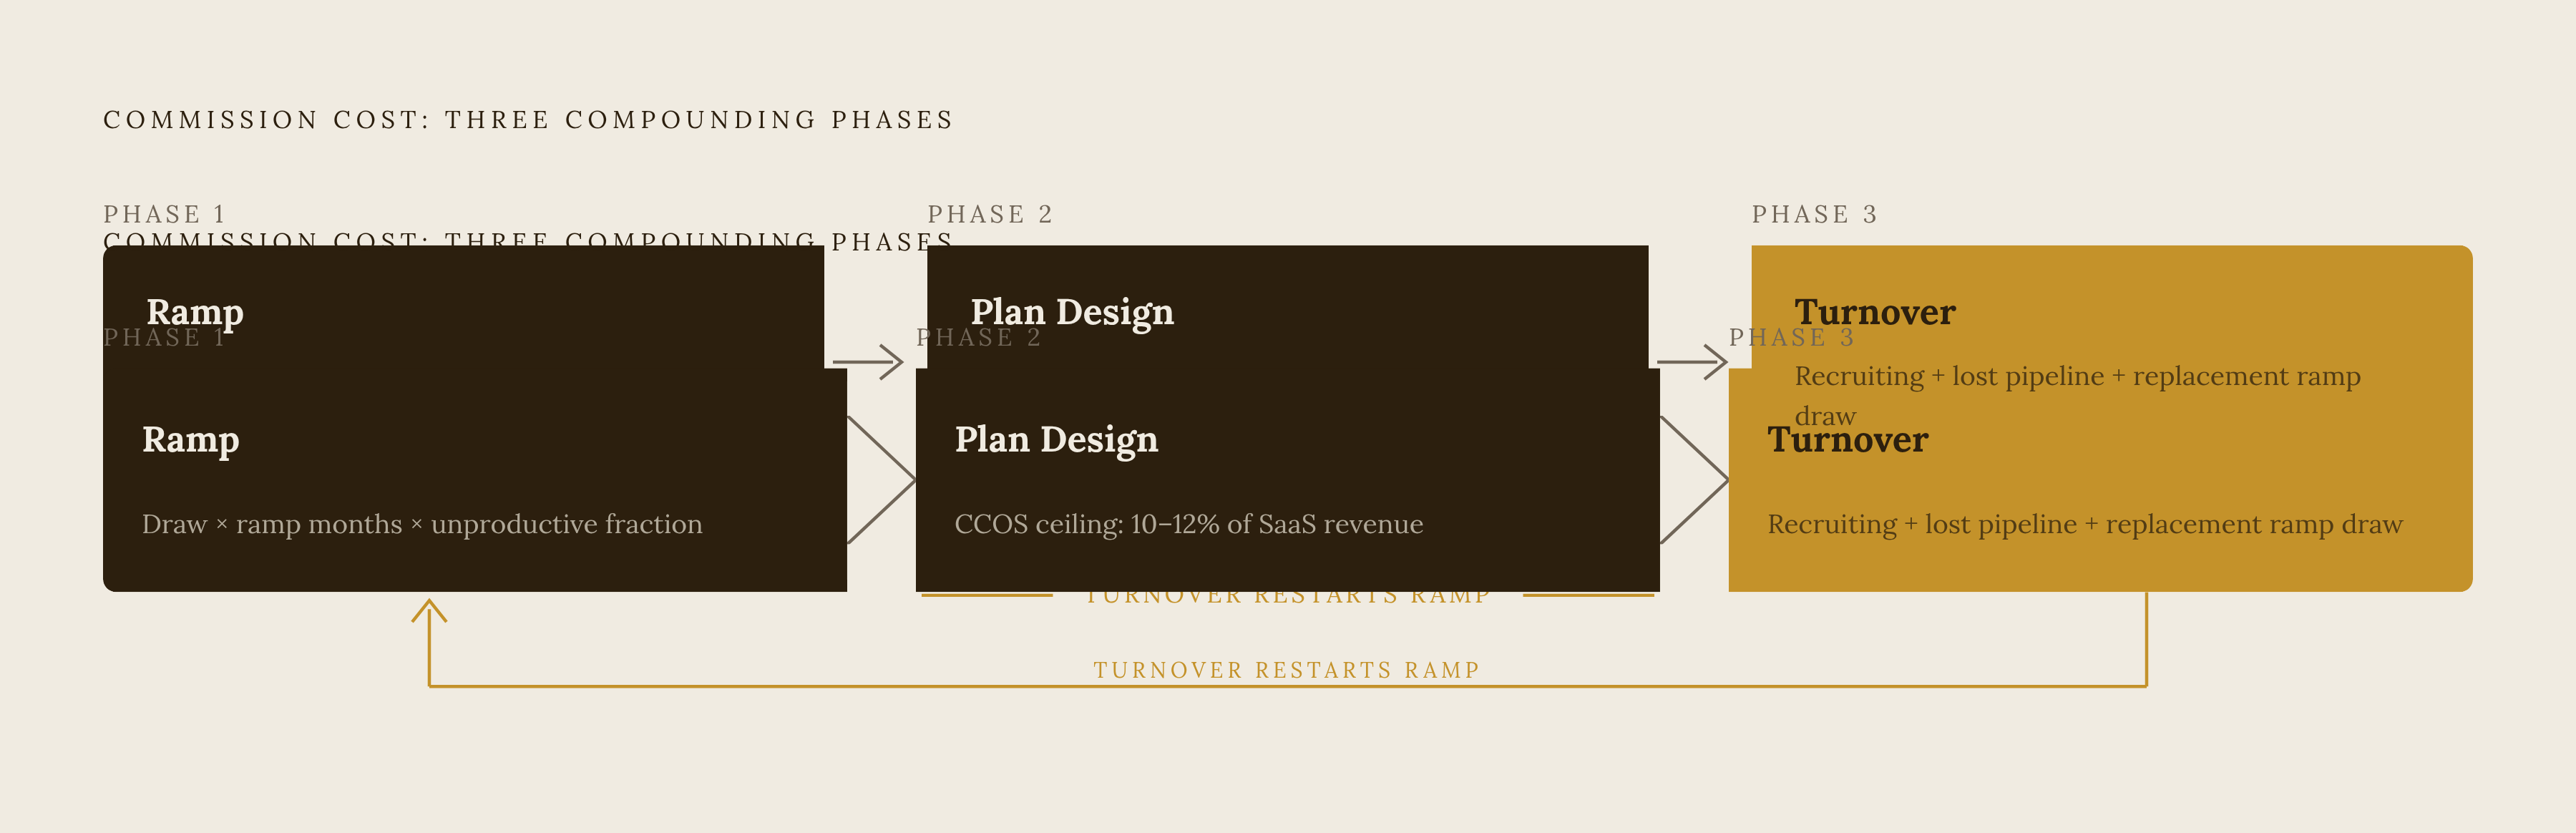
The model begins with a ramp schedule by role and segment. Use the 2026 role and industry-sector benchmarks as the initial duration estimate, then specify the fraction of full quota attainment expected in each month. Record whether the draw is recoverable or non-recoverable and assign a realistic collection rate to recoverable balances. Add the hiring cadence so that overlapping draw windows appear in the same forecast period. Together, these inputs establish the first layer of liability before any accelerator assumptions enter the model.
The next step is to apply the commission plan to the attainment distribution at projected team size. Model AE, AM, CSM, and leadership override structures separately rather than using a blended rate that conceals their differences. Test cap and accelerator scenarios at median attainment, at the 80th percentile, and in a blowout quarter. These scenarios bound payout exposure more usefully than a single average. They also show whether a plan the business can afford at ordinary attainment costs too much in an upside quarter.
Compensation cost of sales, or CCOS, provides the governing constraint for that test. The SaaS benchmark ceiling is 10–12%, and plans that breach the target at projected headcount need redesign before hiring proceeds. The test identifies where the quota, rate, or accelerator structure produces liability beyond the business model’s target. That decision belongs before the expansion commits Finance to a larger payout base.
The final layer applies baseline annual turnover to projected headcount and assigns replacement cost by role. Include recruiting, onboarding, lost pipeline, and the replacement hire’s ramp draw so that the cycle is fully represented. Monitor quota attainment distribution, dispute frequency, and whether the plan can be explained quickly as leading indicators of that cost. The combined output should be a commission liability range for each quarter of the expansion plan. Ramp duration, attainment, and turnover vary, so a range is more defensible than a point estimate that conceals those assumptions.
Where manual commission processes break down under expansion pressure
Even a sound model needs payout records that can be trusted. Spreadsheet processes that work at five reps start to break down at fifteen or twenty, when more calculations and more users make it harder to find errors. Formula drift is one such weakness because a user can overwrite a formula cell without warning. A typo in a nested calculation can miscalculate an entire cohort and remain unnoticed across multiple pay periods. By the time a rep disputes the payout, the error has already reached beyond one calculation.
Version conflicts create a different failure when operations managers work from separate copies of the commission file. Without a single source of truth, the pay period in which the discrepancy surfaces absorbs the reconciliation work. An absent audit trail adds further cost because proving a historical payout can require a multi-hour reconstruction. During a dispute or an ASC 606 audit, that is more than an inconvenience. It creates compliance exposure where the historical integrity of commission records is required.
These weaknesses can also lead to turnover because reps turn to shadow accounting when they cannot trust the official number. Reliable commission operations therefore support both financial control and the replacement-cost assumptions in the model. ASC 606 and IFRS 15 add requirements around commission capitalization workflows, locked pay periods, and approval evidence that manual processes cannot reliably support at scale. Moving the calculation out of a spreadsheet is not enough if those controls remain manual. The process must preserve the evidence needed to explain the payout later.
Integration depth is the key evaluation criterion when moving to dedicated commission software. Commission data needs to flow automatically from CRM events rather than through periodic manual exports that still require the data to be reconciled elsewhere. Because commission data is compensation data, security requirements include encryption in transit and at rest, org-scoped tenancy, and a no-training-on-customer-data policy. Most organizations complete migration in six to eight weeks. Discovery and data prep, configuration, a parallel-run pay cycle, and go-live each take one to two weeks.
The plan review cadence that keeps commission cost models current
A model built for an expansion plan reflects the assumptions in force when it was built. Those assumptions can change as team size, plan design, and attainment change, so annual review alone is not a sufficient trigger. Performance signals must also lead to a review before the same variances keep adding to costs. If fewer than roughly half of reps hit quota for two consecutive quarters, the plan has a structural problem that can produce compounding turnover expense. That signal calls for examination of the plan alongside an updated forecast of lower attainment.
CCOS drift also calls for a review when compensation cost of sales falls outside the business model’s target range. Quota, rate, or accelerator design then needs recalibration before the next cohort enters ramp. Concentrated accelerator spend also warrants review if a small fraction of reps captures a disproportionate share of payouts. That concentration indicates that the attainment distribution has moved away from the design assumption. Updating the model makes the new cost visible before it is applied to more hires.
Structural changes belong at the start of a fiscal year or quarter because mid-quarter changes can destabilize trust and restart the dispute-to-departure loop. Finance and RevOps therefore need enough lead time to decide on a redesign and communicate it before the quarter begins. Locked pay periods and logged approvals keep the record needed to trace how actual cost later differs from the forecast. Documented ramp, attainment, turnover, and plan assumptions support a board-defensible cost range for the next cohort rather than a headcount budget that leaves commission liability to emerge after hiring.