Commission Dispute Frequency as a Leading Indicator of Rep Attrition
Monitor your reps' commission disputes before they hand in their resignations.
Commission dispute frequency is a measurable leading indicator of which reps are about to walk. It's a measurable leading indicator of which reps are about to walk, and most organizations already have the data to read it, they just aren't looking. The industry treats a dispute as closed once the check gets corrected. The rep doesn't experience it that way.
Each dispute lands in a private ledger the rep keeps on the company, even if they would never call it that. A dispute resolved in the company's favor still costs hours of finance time, pulls a manager's attention away from coaching, and slowly wears down the rep's belief that the comp system is fair, salescookie.com's research finds. The outcome of the dispute barely matters. The dispute having to happen at all is what matters.
The scale of this problem is not small. The Quotapath 2024 Compensation Trends Report puts the share of reps filing at least one commission dispute per year at 22%. Of voluntary sales resignations, roughly 9% trace directly to commission errors or disputes, nearly a tenth of all rep churn attributable to a single, trackable cause. And only 21% of companies say they're satisfied with their own sales compensation plans. If close to one in ten departures is commission-driven, and dispute activity is something finance already logs, then the signal exists. The industry just hasn't built the habit of reading it before someone resigns.
What Makes Sales Rep Attrition Expensive
Sales turnover doesn't behave like turnover anywhere else in the company. Average annual turnover for sales positions runs near 35%, a 2025 figure from visdum.com shows, far above the 13% cross-industry average. Separate research puts 45% of B2B sales organizations above 30% turnover. Sales turnover near 35% against a 13% cross-industry average reflects a structural problem. It's structural.
Replacing a rep costs far more than the recruiting line item suggests. DePaul University's Center for Sales Leadership documented a fully loaded replacement cost of $114,957 to $150,000 per B2B sales rep once recruiting, onboarding, training, and the lost sales from a vacant territory are counted. And that territory doesn't sit idle for a few weeks. The same research puts average time to full replacement at roughly six months, which means an open patch bleeds pipeline for half a year while a new hire ramps.
Run the math on a mid-sized team. Thirty reps at 35% turnover lose ten or eleven people a year. If commission disputes drive even one in five of those departures, that's two resignations that didn't have to happen, and at $130,000 average replacement cost, that's over a quarter million dollars annually before anyone accounts for the pipeline that went cold in the empty territory.
The reps who leave matter as much as how many leave. Top performers have the most to lose from a miscalculated payout and the most outside options waiting for them, so the attrition risk skews toward the top of the performance curve rather than spreading evenly across it. Compounding the pressure, Bridge Group data cited by HubSpot shows average B2B rep tenure has compressed to roughly 18 months. The replacement clock is running faster than most planning cycles account for.
How dispute patterns accumulate into an attrition risk signal
Disputes cluster. They don't scatter randomly across a comp plan, and that's good news, because it means the pattern is legible if anyone bothers to read it. Salescookie's 2026 research identifies eight root causes accounting for roughly 80% of dispute volume: split assignment ambiguity (about 20%), territory misalignment (about 15%), refund or credit memo timing (about 12%), mid-period plan changes (about 10%), plan ambiguity (about 10%), CRM or billing data lag (about 10%), currency and FX handling (about 8%), and rep manual error (about 5%).
The attrition signal doesn't live in any single filed dispute. It lives in the accumulation. A rep filing across multiple root-cause categories over successive pay periods isn't hitting bad luck, they're experiencing systemic failure. A rep whose disputes keep getting resolved against them, or who waits past SLA for any acknowledgment at all, is accumulating a trust deficit with every cycle that passes. And the highest-risk profile in any pipeline is the high performer with escalating dispute frequency: they track their earnings to the dollar, they have somewhere else to go, and they read process failure as a verdict on how much the organization respects them.
Harvard Business Review's 2026 analysis, via salescookie.com, has documented that uncertainty about commission outcomes ranks among the strongest predictors of voluntary rep turnover. That's the causal thread connecting a spreadsheet correction to an exit.
Building a rough attrition risk score from data that already exists isn't complicated. Weight dispute frequency (filings per pay period over the trailing six months), dispute category (systemic causes like split ambiguity or data lag should score heavier than a rep's own manual error), resolution time (anything that misses SLA adds weight), resolution trend (repeated rulings against the rep versus in their favor), and performance tier (reps above quota carry more weight, since they have the most to lose and the most alternatives). None of this works in isolation. It needs to sit alongside tenure, quota attainment, and whatever signal exists about the manager relationship. But dispute frequency is the one input in that list that finance is already producing and almost never routing to anyone thinking about retention.
No published study has pinned down a precise dispute-frequency threshold above which resignation odds cross some specific line. The argument here is directional and operational, not actuarial. That doesn't make it less real, it just means the tool is a compass, not a calculator.
The baseline rates that separate normal friction from a warning sign
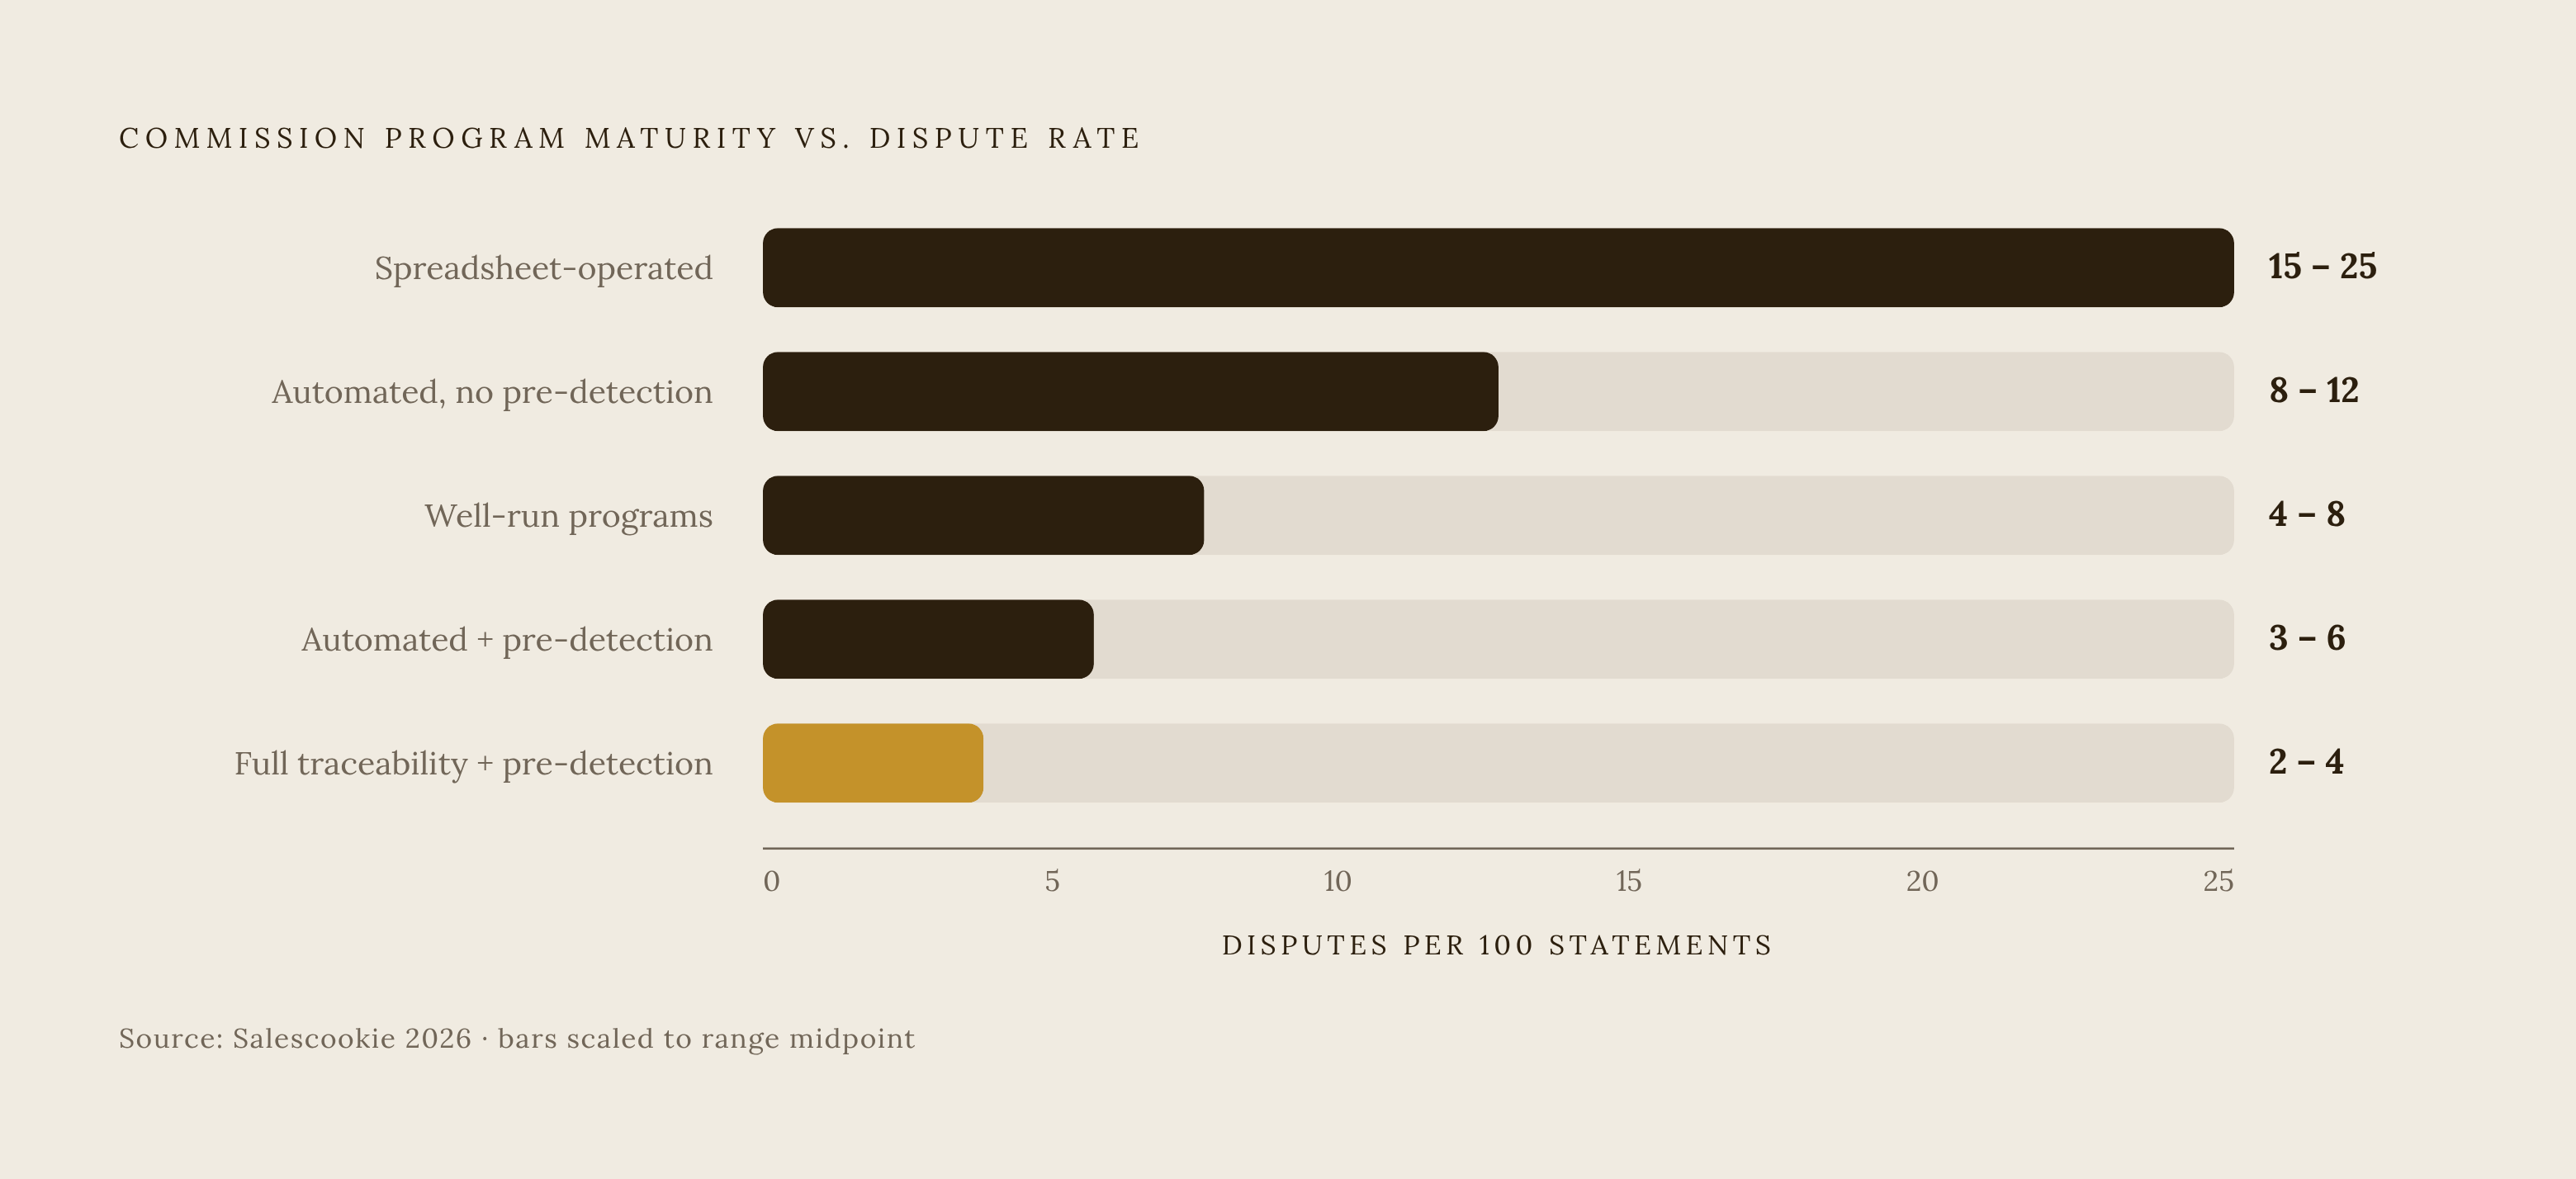
Not every dispute rate is a red flag. Salescookie's 2026 research lays out a clear spread by operational maturity: well-run programs see 4 to 8 disputes per 100 commission statements; spreadsheet-operated programs run 15 to 25 per 100; automated systems without any pre-detection are 8 to 12 per 100; automated systems with pre-detection drop to 3 to 6 per 100; and automated systems with full statement traceability plus pre-detection get down to 2 to 4 per 100.
Compare that against how reps actually experience the process. Salesforce's State of Sales 2024 found more than 60% of reps had experienced a commission error in the prior 12 months, which means plenty of organizations sitting comfortably in the 15-to-25 band, or even below it, don't know how exposed they are, because not every felt error becomes a formal dispute. A rep who stops filing isn't necessarily satisfied, the absence of formal disputes doesn't mean the underlying errors have stopped.
Seasonality matters too. Dispute volumes tend to shift when plan conditions change, new territories, new rules, and new rate structures all create friction that shows up in the numbers. A spike tied to a known plan transition is expected. A spike that persists well beyond that transition is diagnostic, and it means something structural didn't get fixed.
Operationally, this means plotting a program's dispute rate against those four maturity tiers, tracking the trend by quarter rather than settling for an annual number, and segmenting by team, manager, and plan type to find out whether a problem is systemic or localized to one corner of the org. A program sitting consistently above 8 to 12 per 100 statements is generating more attrition risk than a process tweak here or there is going to absorb.
Shadow accounting: the productivity cost that precedes the resignation
Shadow accounting is what happens when a rep stops trusting the commission statement and starts building their own. They keep a private spreadsheet, check every payout against it line by line, and effectively do finance's job a second time, on their own clock. Research estimates this reconciliation behavior costs 2 to 4 hours per rep per week, a figure that understates how far distrust can spread once it takes hold. Multiply that across a hundred-rep organization and it comes out to roughly 12,000 selling hours lost in a year, hours that were supposed to go toward calls, deals, and quota, not toward re-deriving a number finance already calculated.
Shadow accounting spreads the way distrust always spreads: one rep starts double-checking their statement, and the reps around them start wondering if they should be doing the same. It moves from an individual habit to a team norm fairly quickly.
There's a behavioral cost layered on top of the hours. Reps who can't predict how a complex deal will pay out start steering away from complex deals altogether, chasing simpler, lower-risk sales instead of the best-fit mix for the business. Teams with transparent, accurate commission data report win rates 15 to 27% higher than teams without it. Shadow accounting also tends to arrive before the dispute does: heavy shadow accounting on a team is usually a leading signal that the formal dispute spike is coming in the next cycle or two. It can be spotted without ever running a survey, by watching for reps who audit their own CRM records unusually closely before period close, or who ask finance for raw deal exports they'd have no reason to want if they trusted the statement in front of them.
Why Plan Design Flaws Generate More Disputes Than Calculation Errors
The comp plan itself usually causes the problem, and the math running through it simply carries that plan's design out. QuotaPath's 2024 Compensation Trends report found 78% of revenue leaders admit their own reps find the compensation plan difficult to understand, and every single leader surveyed, 100%, agreed the plan needs improvement. Sixty percent of reps take three to six months just to fully grasp how their variable pay works, and every discrepancy that surfaces during that learning curve between what they expected and what they got becomes a candidate for a dispute. Seventeen percent of leaders named plan complexity itself as a direct obstacle to compensation working the way it's supposed to.
Three pieces of a comp plan get conflated constantly, and they shouldn't be: the commission structure (the math, the tiers, the accelerators), the commission policy (the document covering eligibility, clawbacks, deal coverage, timing), and the payout process (the operational workflow that calculates, validates, and delivers the money). Confusing any one of these for another is usually where the argument starts.
Mid-period plan changes account for roughly 10% of disputes by category and are arguably among the most preventable root causes on the list, since they trace almost entirely to documentation gaps rather than calculation bugs. Plan ambiguity drives additional disputes in a similar way, and another 10% and are just as preventable: a deal already sitting in the pipeline should never get hit by a retroactive rule change without an explicit, written heads-up to the rep carrying it.
Clawbacks deserve a specific callout. Ambiguity around when and how a clawback applies is one of the most common flashpoints in the whole dispute category, and the fix isn't eliminating clawbacks, it's documenting them clearly and giving reps advance notice before they close a deal, not after. A useful diagnostic for any plan: hand a new hire a hypothetical deal and ask them to calculate their own commission on the spot. If the answer isn't quick and confident, the plan needs simplifying before the next cycle runs, not after the disputes pile up. Plan design is where attrition risk gets manufactured. Calculation accuracy is visible on a statement, but by then the risk was already created earlier in plan design.
What dispute analytics reveal that exit interviews don't
Exit interviews arrive too late to be useful for anything but a postmortem. By the time a departing rep says "I never trusted the numbers," the decision was made weeks or months earlier. Dispute data, on the other hand, is available while the rep is still on the payroll and still fixable.
Salescookie's 2026 research shows high-performing ops teams run three questions against dispute data every quarter. Which root-cause categories are trending up: rising split-assignment disputes usually point to a territory or role change the plan never absorbed, while rising plan-ambiguity disputes point to a documentation gap that needs an addendum, not a lecture. Which individual reps generate a disproportionate share of disputes: a rep who's consistently right and consistently disputed is dealing with a systemic account-level failure, a different animal entirely from a rep whose pattern points to something a manager needs to address directly. And which managers' teams cluster disproportionately: concentration at the team level usually means a plan configuration issue rather than a string of individual rep complaints.
An exit interview cannot capture timing the way this kind of analysis can, since the dispute spike often shows up before the resignation, which is real lead time to actually do something. Specificity, since the root-cause category tells you whether the fix is a rewritten plan document, a CRM data rule, a territory protocol, or a direct conversation with a manager. And distribution, since exit interviews aggregate sentiment after the fact, while dispute data shows exactly which individuals are at risk and why, while there's still time to act.
PayScale's 2025 Compensation Best Practices Report found that companies introducing clear, achievable OTEs and building trust through pay transparency improved rep retention by 12 to 15%. Dispute analytics is the diagnostic tool that shows precisely where that transparency is breaking down before the rep decides to leave over it. The practical output of a quarterly review shouldn't just be a closed-ticket count. It should be a short list of at-risk reps, a ranked list of plan or process fixes ordered by dispute volume, and a trend line showing whether things are getting better or worse.
Pre-detection: catching the dispute before the rep ever files it
The single most effective change a Sales Ops team can make is running anomaly detection on the statement before it ever reaches the rep's inbox. Salescookie's 2026 research shows companies doing this kind of pre-flight review consistently report a 40 to 60% reduction in formal disputes filed, because most "wait, this looks wrong" moments get caught and corrected before a rep ever sees the number and starts building a case against it.
What should get flagged before a statement goes out: total commission moving more than 30% against the rep's trailing three-month average with no obvious driver behind the swing, and a specific deal credited to more than two reps in a split that wasn't clearly documented up front. Catching either of these before the statement lands doesn't just save a dispute ticket. It removes the moment that would have started the rep quietly building their own spreadsheet, wondering if the system is actually keeping its word.