Replacement Cost Modeling for Sales Rep Turnover Driven by Comp Dissatisfaction
Most sales organizations miss the true cost of losing a rep to pay dissatisfaction.

Replacement Cost Modeling for Sales Rep Turnover Driven by Comp Dissatisfaction.
Sales organizations systematically undercount the cost of losing a rep
Most sales organizations dramatically undercount the cost of losing a rep to compensation dissatisfaction because they only see the recruiting invoice, when a complete replacement cost model built across all six cost categories reveals a much larger number. Sales turnover runs close to 35% a year, nearly three times the 13% average across other industries Everestage Sales Compensation Statistics 2026 Gangly Sales Rep Turnover Statistics. Put that rate against a 20-rep team and six or seven people walk out the door every year, a churn rate large enough to reshape a whole territory plan, yet the dollars attached to it never land on a single P&L line where anyone has to look at them. The replacement cost model needed to see the real number already exists in the data. Most organizations just never run it, so they end up making retention calls, and comp calls, on a fraction of the picture. What follows builds that model layer by layer, then traces how much of it gets triggered by one specific, avoidable cause: compensation dissatisfaction.
The six cost categories that make up a complete replacement cost model
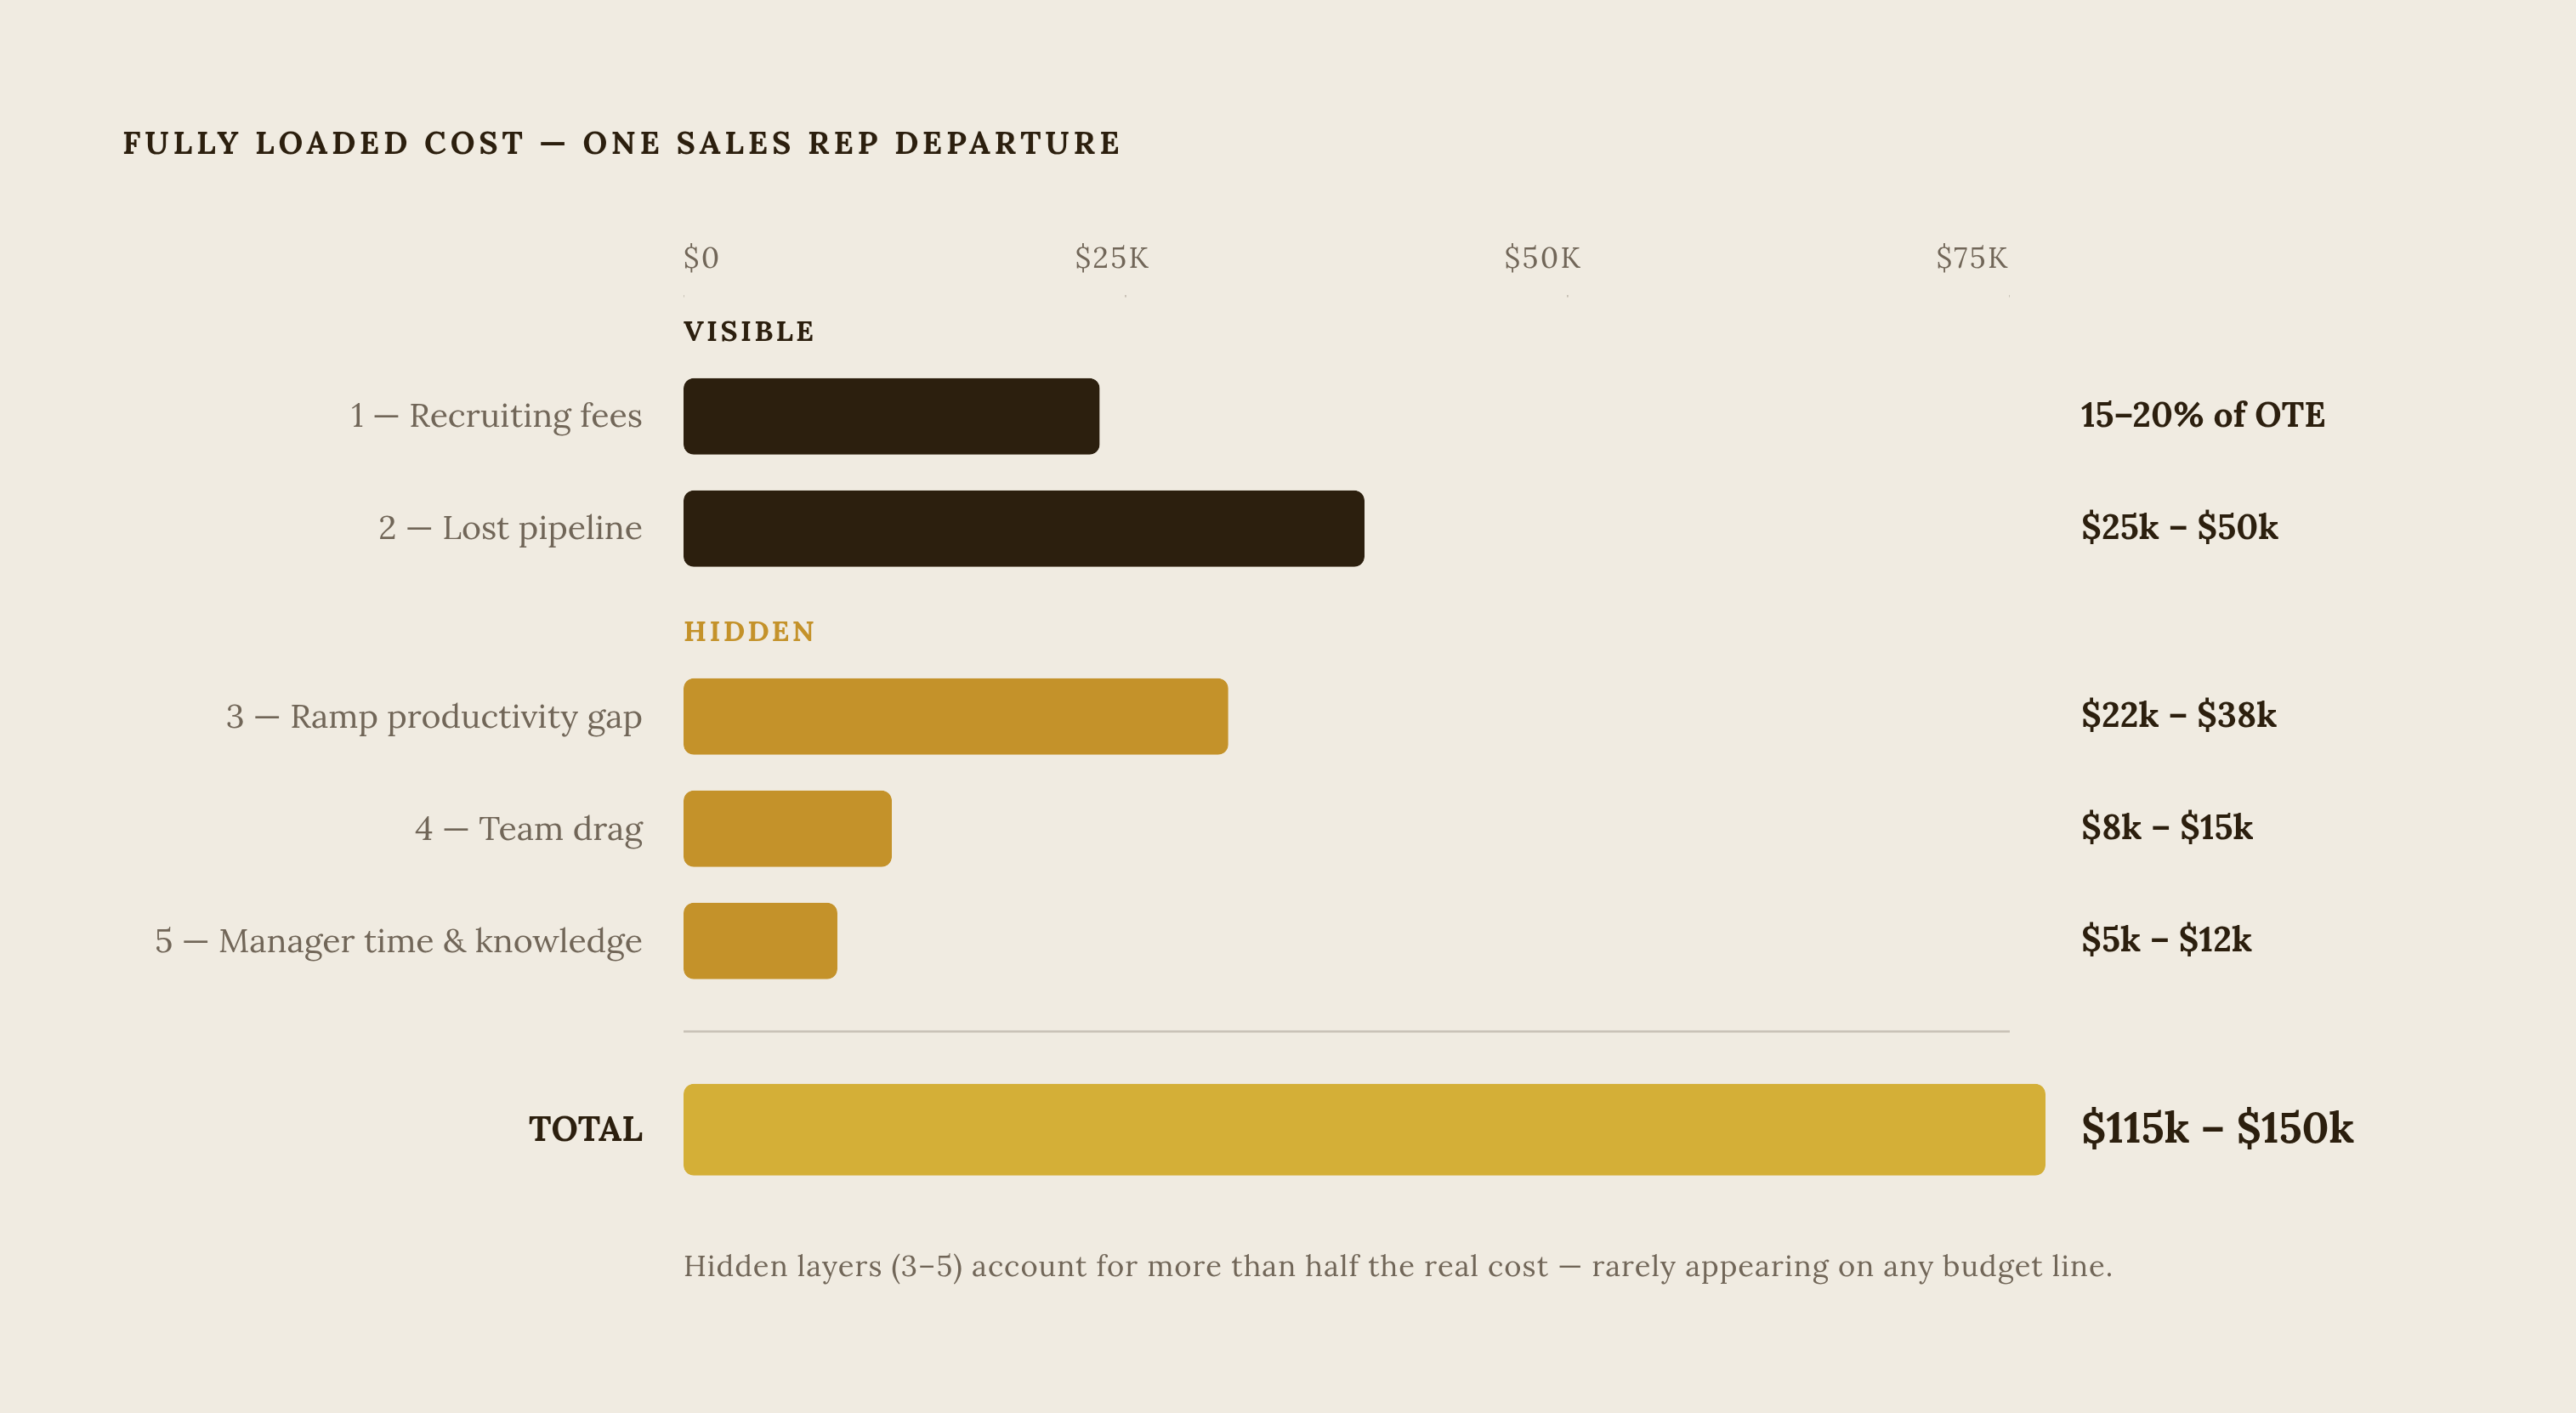
The fully loaded figure, summing all six, is between $115,000 and $150,000 per departure per Salesforce Research and the Outperform Institute Salesforce Research / Outperform Institute Zyverno Cost of Sales Rep Turnover Industry benchmark. For more senior roles, the Bridge Group's 2024 framework, cited by scorecardsales.com, puts the fully loaded cost at 150 to 200% of on-target earnings Salesforce Research / Outperform Institute Zyverno Cost of Sales Rep Turnover Industry benchmark. OTE, not headcount, is the right dial for scaling this estimate to any specific team. Run the arithmetic at the team level and it gets uncomfortable fast: three departures in a single year cost more than $450,000 before anyone even counts the quota shortfall left behind Gangly Sales Rep Turnover Statistics Zyverno Cost of Sales Rep Turnover.
Layer 1 and 2: what the visible costs add up to
Start with the cost everyone already tracks. Agency fees alone typically eat 15 to 20% of first-year OTE, and internal recruiting is not free either: every hour a manager or an interviewer spends on the hiring loop is an hour not spent running the territory SalesSo Research.
The second layer is where the visible costs start to expand past what most finance teams model. The average sales role sits open for 45 to 60 days, and the territory goes uncovered for that entire stretch Zyverno Cost of Sales Rep Turnover. Even with clean CRM hygiene, 30 to 40% of in-flight opportunities degrade or die outright once the owning rep leaves MarketBetter SDR Turnover Cost Analysis 2026.
That's the number most sales leaders think they're managing. It's less than half the real one. SDR OTE benchmarks at $65K–$85K, so agency fees alone can absorb most of the Layer 1 low estimate Glassdoor, Martal / MarketBetter. Lost pipeline during vacancy, the Layer 2 cost, is put by MarketBetter's model at $25,000–$50,000 per departure. For a rep managing 50–100 active prospects, that is 15–40 conversations restarting from scratch Industry benchmark. These two visible layers alone (the ones that do get discussed) already approach $50,000–$85,000 per departure before the larger hidden categories are added.
Layer 3: the ramp productivity gap and its cost relative to the recruiting invoice
Ramp time shifts focus away from the departed rep because the model now has to account for the replacement's productivity curve instead. The average sales rep takes 5.7 months just to reach baseline productivity, not full quota attainment, baseline Zyverno Cost of Sales Rep Turnover. SDR roles ramp faster, 3.1 to 3.2 months on average, but average SDR tenure is only 14 to 16 months Zyverno Cost of Sales Rep Turnover Bridge Group. Most SDRs are gone before they complete a second full productivity cycle Zyverno Cost of Sales Rep Turnover Bridge Group.
The gap widens further in complex technical sales. Where sales cycles stretch 12 to 18 months, ramp itself can extend to 12 to 18 months, and the productivity hole during that stretch scales with it, though the exact dollar figure depends heavily on what a given rep's territory would have produced PayScale 2025 Compensation Best Practices Report. A new hire doesn't sit at zero output and then flip to full speed. The curve climbs gradually, and that gradual climb is exactly what makes the cost so easy to miss: it's paid out in small, daily shortfalls that barely register individually but add up to a large number by the time anyone checks. SDR churn amplifies all of this. At 45% annual churn, the highest of any sales role, against roughly 30% for AEs, the ramp cost recurs most often in the exact role that also has the shortest runway to earn it back Zyverno Cost of Sales Rep Turnover MarketBetter SDR Turnover Cost Analysis 2026 Gangly Sales Rep Turnover Statistics. SDR-heavy teams absorb this cost disproportionately. MarketBetter's 2026 ramp productivity loss estimate for SDR roles is $22,000–$38,000 per departure after netting out the meetings the new hire does book against salary paid during ramp Gangly Sales Rep Turnover Statistics MarketBetter SDR Turnover Cost Analysis 2026. For mid-market AE roles, the foregone revenue during ramp is in the same $22,000–$38,000 range per the getgangly.com data Gangly Sales Rep Turnover Statistics MarketBetter SDR Turnover Cost Analysis 2026.
Layers 4 and 5: the costs that compound inside the existing team
Turnover doesn't stay contained to the empty seat. It spreads into the team that's still there. During stretches of high turnover, sales managers spend 25 to 50% of their working hours on hiring activity, hours that come directly out of coaching time for the reps who didn't leave Gangly Sales Rep Turnover Statistics.
That sets up a loop that feeds itself: turnover eats the exact coaching capacity that would have prevented the next departure, so high churn doesn't stay flat, it compounds.
When a rep departs, the institutional knowledge lost is valued at $5,000–$12,000 per departure. CRM data quality slides as a direct result: notes go stale, follow-ups get dropped, and a meaningful share of the 30 to 40% pipeline degradation counted back in Layer 2 traces straight back to this knowledge gap MarketBetter SDR Turnover Cost Analysis 2026. Layers 4 and 5 almost never appear as their own budget line anywhere. They get absorbed silently as reduced output and manager burnout, which is exactly what makes them politically invisible even as they pile up.
Stretched over a three-year window at roughly two turnover events per seat (statistically likely at current tenure rates), this stops looking like a one-time hiring expense and becomes a recurring structural cost Zyverno Cost of Sales Rep Turnover MarketBetter SDR Turnover Cost Analysis 2026. It reads as a recurring structural cost baked into how the org runs Zyverno Cost of Sales Rep Turnover MarketBetter SDR Turnover Cost Analysis 2026. Team drag, the Layer 4 cost, is put by MarketBetter's model at $8,000–$15,000 per departure. Bridge Group data, via MarketBetter, shows teams that experience turnover see a productivity dip across remaining members for several weeks.
Compensation dissatisfaction as a structural trigger, not just one reason among many
"Reps leave for money" is the explanation everyone reaches for, and it's not wrong so much as it's too blunt to be useful. The sharper version: reps rarely leave over the commission rate itself, they leave over confusion about what that rate actually pays out. Gartner data shows 64% of sales professionals say they'd leave for a similar role at better pay, and the word doing the real work there is "similar" Everestage Sales Compensation Statistics 2026. What's driving the decision isn't the number on the offer letter, it's whether the value exchange feels fair and legible where they currently sit Everestage Sales Compensation Statistics 2026.
Layer that against burnout, which Gartner puts at 90% of sellers reporting it, and a mechanism comes into focus: a rep who cannot predict what they're going to earn cannot plan around it, and that unpredictability accelerates disengagement well before anyone updates a resume Everestage Sales Compensation Statistics 2026 Spreadsheet Study 2017. Missed quota makes the problem worse. The Fullcast 2025 Benchmarks Report puts the miss rate at 76.6% of sellers, even against targets that had already been lowered Gangly Sales Rep Turnover Statistics. A missed quota compresses variable pay, and compressed variable pay widens the gap between what a rep expected to earn when they took the job and what actually lands in the account Gangly Sales Rep Turnover Statistics Fullcast 2025 Benchmarks Report.
Underneath all of it sits a transparency problem. Only 19% of U.S. companies have a formal pay transparency strategy, which means most reps are trying to manage their own compensation with incomplete information, and every unexplained discrepancy in a paycheck reads as evidence that something bigger is wrong Fullcast Real-Time Compensation Transparency Tools. That's the structural part of the argument: comp dissatisfaction does not require an actual mistake to trigger an exit. Opacity alone is enough, because a rep filling in a gap of uncertainty tends to fill it with the worst-case explanation, not the most charitable one. Technology and SaaS organizations feel this most acutely Gangly Sales Rep Turnover Statistics Xactly 2025 / Zyverno Cost of Sales Rep Turnover. Xactly's 2025 data puts turnover in the sector 67% higher than elsewhere, driven largely by aggressive competitor recruiting layered on top of compressed compensation windows, which makes this a live, expensive problem in exactly the industry where most of this piece's readers are running teams Gangly Sales Rep Turnover Statistics Xactly 2025 / Zyverno Cost of Sales Rep Turnover.
The retention math when transparency is treated as an investment
Run the fix through the same model, and the payoff is concrete. Companies that introduce clear, achievable OTEs and build genuine trust through pay transparency have seen rep retention improve by 12 to 15%, PayScale's 2025 Compensation Best Practices Report found Gangly Sales Rep Turnover Statistics PayScale 2025 Compensation Best Practices Report Industry benchmark.
The return calculation writes itself from there. Even one or two avoided departures a year produces savings that dwarf whatever it costs to put structured commission management in place. Organizations that tightly align sales compensation with core business objectives are 34% more likely to hit revenue targets, Commissionly's 2025 GTM Benchmark Report found Gangly Sales Rep Turnover Statistics Commissionly 2025 GTM Benchmark Report. This means the investment that keeps reps from leaving is the same investment that makes the ones who stay perform better. 71% of organizations now tie compensation directly to measurable performance goals Commissionly Sales Compensation Best Practices. The companies still running comp off spreadsheets and guesswork are the laggards absorbing a turnover premium the rest of the industry has already priced out.
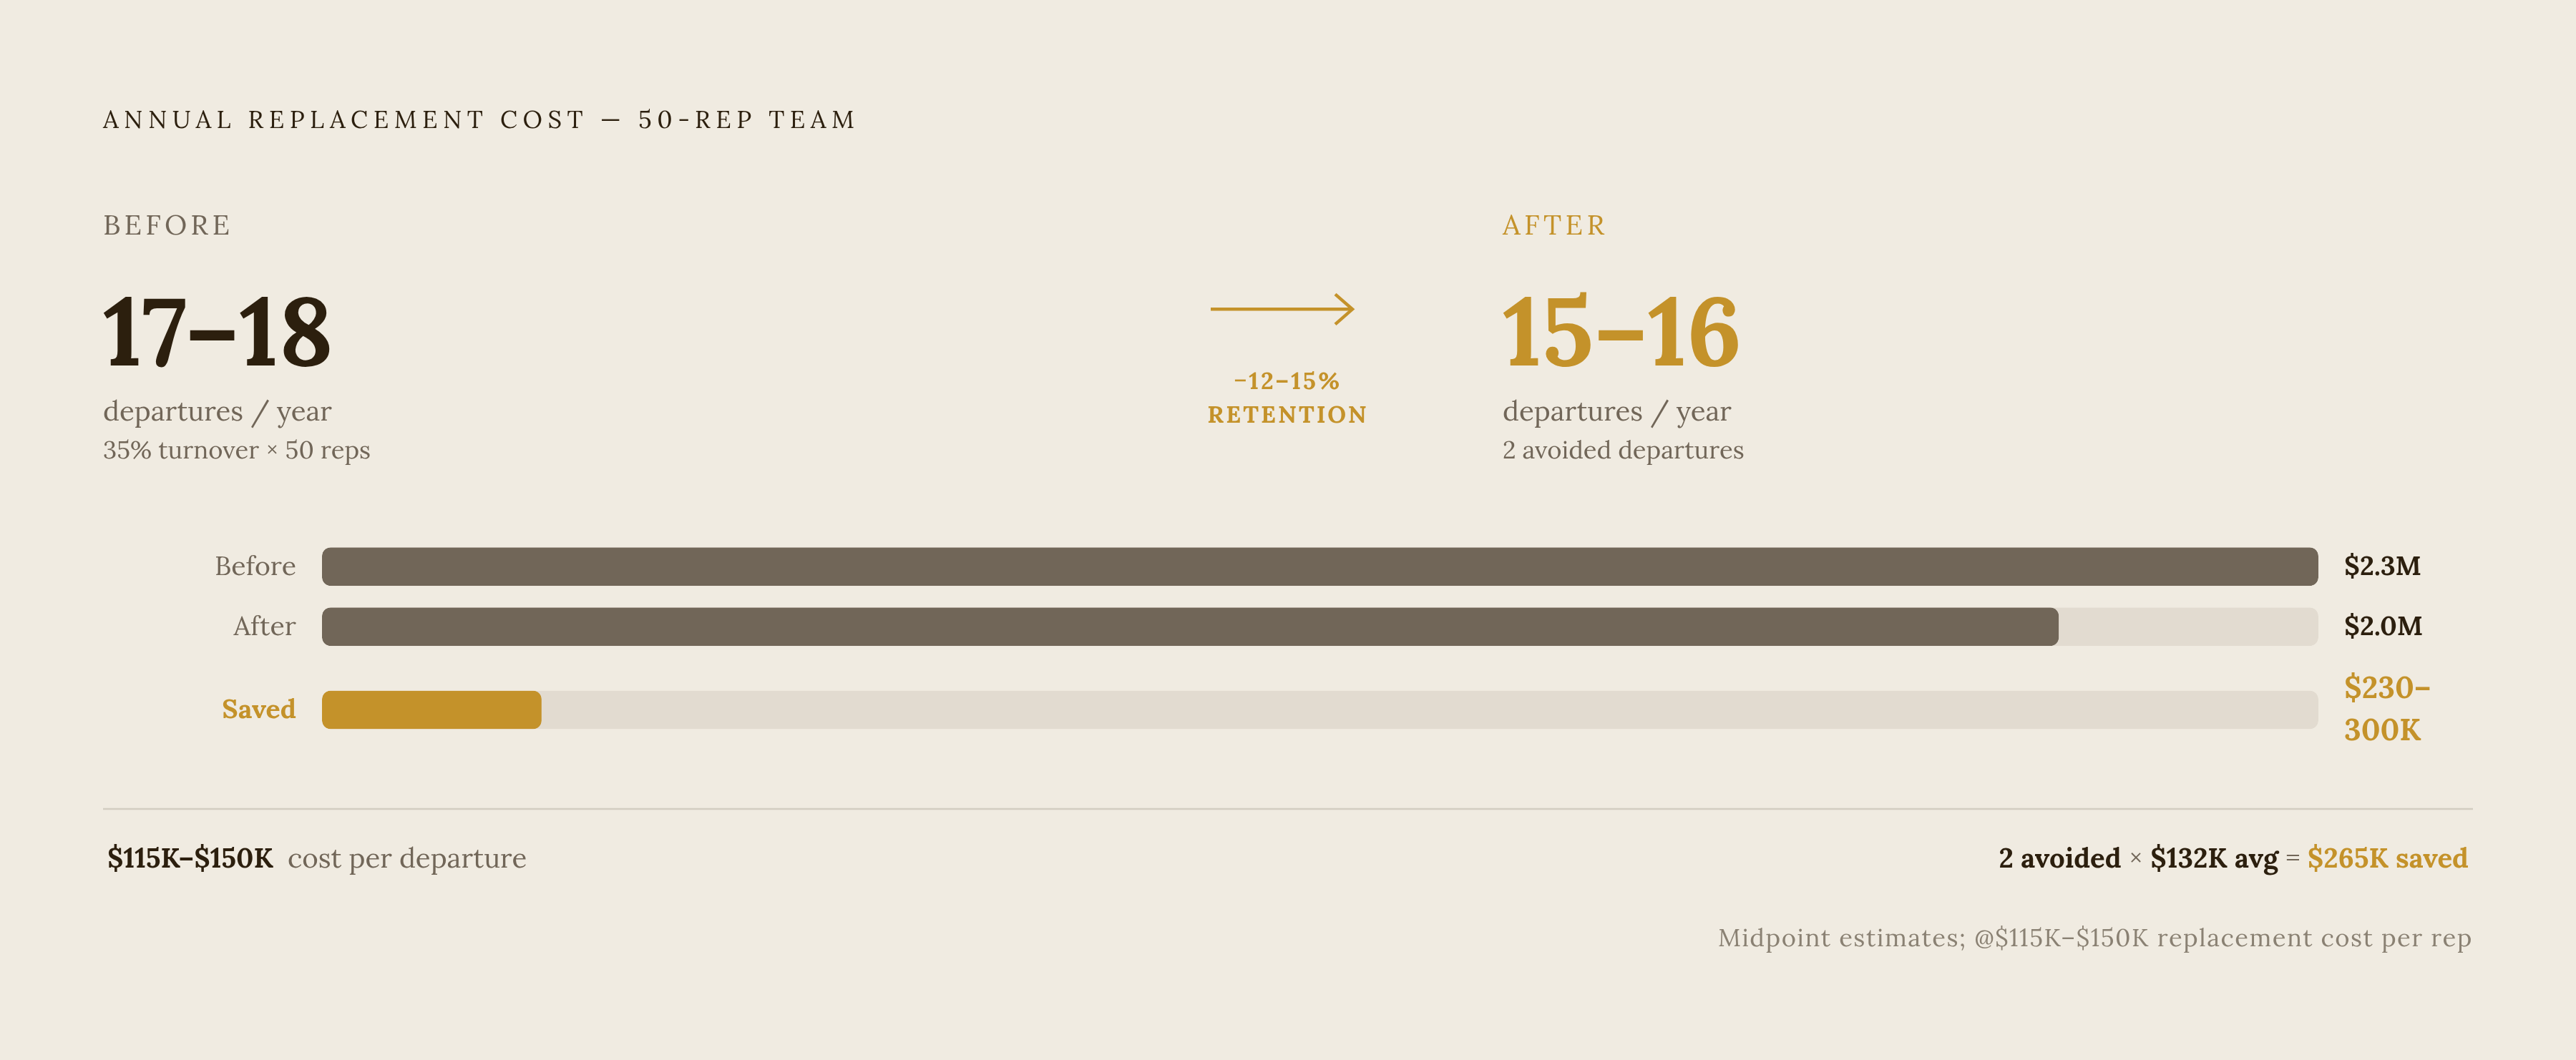
That's not a coincidence, either. The organizations that undercount their turnover cost tend to be the same ones that never got around to investing in comp transparency. Applying that 12–15% retention improvement to a 50-rep team at 35% baseline turnover, the team goes from replacing roughly 17–18 reps per year to replacing roughly 15–16, and each avoided departure saves $115,000–$150,000 Everestage Sales Compensation Statistics 2026 Salesforce Research / Outperform Institute Zyverno Cost of Sales Rep Turnover Industry benchmark.
How spreadsheet-based commission management creates and sustains comp dissatisfaction
The mechanism behind that blind spot is this: Reps who don't trust the official numbers start keeping their own, and once a rep is running a shadow spreadsheet in parallel with Finance, a VLOOKUP error that underpays them gets noticed by the rep first, not by the team that's supposed to catch it, a gap that turns a routine mistake into a trust problem. It's a routine mistake that becomes an accuracy dispute with no clean audit trail behind it. It's an accuracy dispute with no clean audit trail behind it, an event that turns a vague sense of unfairness into a specific, attributable grievance.
A SHRM workforce study, cited via sequifi.com, found that pay errors directly raise an employee's intent to leave. In commission-heavy sales orgs, the reps tracking their own comp most closely tend to be the top performers. The people most likely to catch an error are also the people the business can least afford to lose. And the errors are not rare. A DOSS survey found 22% of operations professionals deal with spreadsheet errors daily, with 59% pointing to manual data entry mistakes and 46% to formula errors as the leading causes DOSS 2026 Survey.
Underneath the error rate sits a version-control problem that's arguably worse. Concurrent edits, emailed file versions, no single file anyone can point to as the authoritative one, all of it creates a situation where Finance and the rep can both be technically correct according to their own copy of the spreadsheet. Without one locked, auditable record, there's no clean way to resolve the disagreement, only a negotiation about whose math to trust. At scale, this gets worse fast: a single bad pay cycle, a plan change, or a batch clawback, or a trigger event that fires late, can generate a wave of simultaneous disputes that pull Finance and sales leadership into days of reconciliation work. And the damage isn't symmetric. One unexplained discrepancy erodes more trust than a month of clean, accurate payouts can rebuild. The spreadsheet's real vulnerability isn't just its error rate; it's the doubt it plants about the error possibly never being an accident. Underpayments chip away at retention. Overpayments create legal exposure. Unaudited spreadsheet environments produce both outcomes more often than an environment with a locked record behind it.
How structured commission management fixes the six cost categories
Put the six cost categories and the comp-dissatisfaction trigger side by side, and the fix maps cleanly onto both. On calculation accuracy, a structured commission platform swaps out manual data entry and fragile spreadsheet formulas for a no-code calculation engine wired directly into CRM data from systems like Salesforce or HubSpot, which closes off the exact formula-error and manual-entry failure modes the DOSS survey's 22% daily error rate documents DOSS 2026 Survey.
That single change touches more of the six-category model than it might first appear. A locked, auditable calculation record removes the shadow-spreadsheet dynamic that turns one bad pay cycle into a wave of eroded trust, which is the same trust that, left unaddressed, feeds the comp-driven exits driving up Layers 1 through 3 in the first place Zyverno Cost of Sales Rep Turnover MarketBetter SDR Turnover Cost Analysis 2026. None of this is a claim that better software eliminates turnover. It's a narrower, more defensible one: the fraction of turnover that comp opacity and pay error are actually causing is fixable, and the model built across this piece puts a real number on what fixing it is worth. Having established six cost categories and a structural driver (comp dissatisfaction created by opacity and error), this section maps the fix to each. SOURCE PAGES, what the pages behind the outline's links say.